Richard Drury
Overview
When I previously covered XAI Octagon Floating Rate & Alternative Income Trust (NYSE:XFLT), I went into detail about the structure of the fund and the specific risks associated with collateralized loan obligations. I outlined the leveraged loan default rates and how the higher interest rate environment could potentially increase the amount of bad loans for XFLT. However, I believe that recent economic data indicates a shift in the market, and I anticipate interest rate cuts to happen before the end of the year. These interest rate cuts could serve as both a positive price catalyst as well as a source of relief for XFLT’s portfolio of investments.
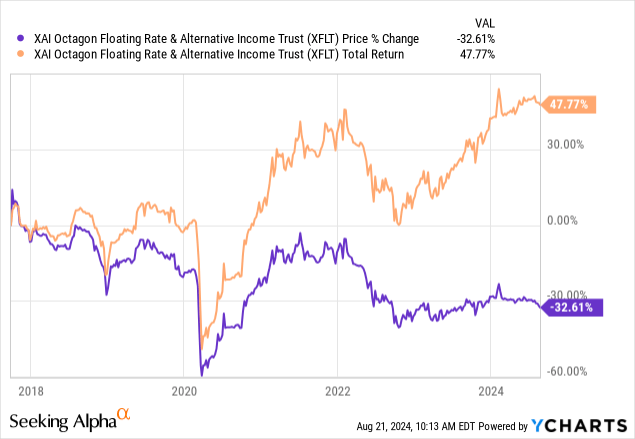
XFLT operates as a closed end fund that maintains exposure to a portfolio of floating rate credit instruments. The fund typically invests about 80% of its assets into a mix of senior secured debt investments, CLO debt, and CLO equity. The fund is advised by XA Investments and has a public inception dating back to 2017. XFLT is best utilized as an income investment since the dividend yield sits at a high 14.9%. Looking at the fund’s performance, we can see that the price has retracted down about 32% since inception, while the high distribution rate helps boost the total return above 47% over the same time frame.
Something that makes XFLT an appealing income investment is the fact that the distributions are paid out to shareholders on a monthly basis. This adds a level of flexibility for investors that may depend on the income generated from their portfolio, such as retired investors. As with most income-based investments, one of the most important aspects around the valuation of a fund like this is when you initiate a position. XFLT current trades near its fair net asset value and presents an attractive opportunity to begin accumulating shares. I believe that the future outlook of the fund looks great and this is supported by its diverse portfolio strategy.
Portfolio Strategy
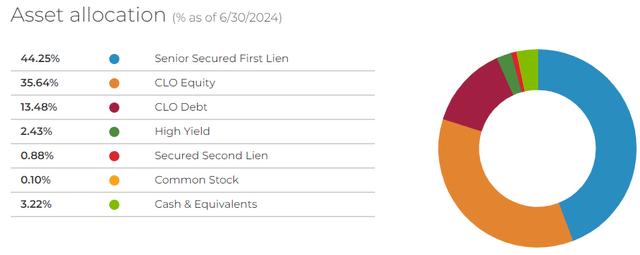
XFLT’s primary goal is to seek attractive total returns through consistent income generation strategies that can remain efficient across different credit cycles. They do this by maintaining a diverse exposure across holdings and asset allocation. According to the most recent fact sheet, there are approximately 554 individual holdings within XFLT that are spread across mostly senior secured debt investments, CLO equity, and CLO debt investments.
It should be clearly understood that XFLT is able to generate such a high yield from its portfolio of investments because they focus on investments into businesses that have poor credit ratings. This means that XFLT operates in the risky area of ‘below investment grade’, where the average credit rating typically sits at BB+ and below. Below investment rated borrowers typically don’t have strong balance sheets with strong cash cushions to weather headwinds. As a result, this higher interest rate environment can cause a higher rate of defaults. Higher interest rates directly translate to higher interest payments required from borrowers of floating rate debt.
Senior secured first lien debt investments are the core of XFLT’s portfolio, making up 44.25% of its net assets. This senior secured first lien debt can be seen as the source of stability for XFLT because of the structures involved with these kinds of investments. For instance, senior secured debt investments sit at the top of the corporate capital structure, which means that it has the highest priority for repayment. This helps reduce overall risk associated with investments defaulting on their loans. If a borrower goes through a bankruptcy and has to liquidate assets, XFLT’s senior secured loans are entitled to some of the recovered capital first before other forms of debt.
The remaining portions of the portfolio is mostly composed of a mix between CLO equity and CLO debt. CLO equity has the highest level of risk since it sits at the very bottom of the capital structure. As a result, CLO equity investments are the first to absorb losses and is where the largest slice of underperformance due to defaults may come from. CLO debt does sit a bit higher on the structure, but still carries the same vulnerability of being made up of below investment rated borrowers.
Another strategy that XFLT implements is the use of leverage. Leverage can introduce higher amounts of risk, but it can also amplify returns when used opportunistically. As of the latest fact sheet, the effective leverage used sat at 39.34% with an average cost at 6.81%. Not only would future interest rate cuts serve as a positive catalyst for the borrowers within XFLT’s portfolio, but it would also mean that XFLT would be able to use leverage more effectively at a lower cost.
Catalyst: Interest Rate Cuts
Since XFLT hasn’t operated on a public scale for ten years, the performance history is a bit limited. This is important because it means that XFLT has never really experienced long stretches of time when it could operate in a ‘normal’ interest rate environment. Looking at the chart below, the fund launched at a time when the federal funds rate was actively being hiked. Shortly after those hikes happened, the pandemic of 2020 shook markets and caused the Fed to cut rates to near zero levels. Now in present times, we are experiencing interest rates that sit at their decade highs, which can add strain to borrowers and deteriorate the quality of portfolios that contain below investment grade borrowers.
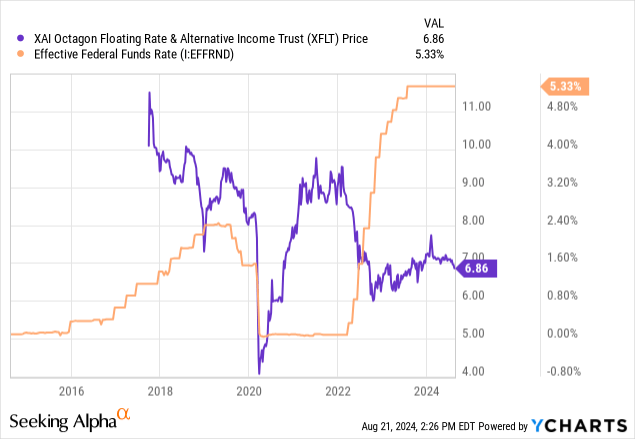
It’s no coincidence that when interest rates were cut to near zero levels in 2020 we saw XFLT’s price rapidly move to the upside. The upside movement experienced throughout 2020 and 2021 was one of the best price runs that XFLT has ever had in its short history. Near zero interest rates meant that borrowers could access debt financing at low costs. This debt could be used to fund operational growth through different initiatives such as acquisitions, product and service expansion, or funding additional market research. As a result, this environment fueled higher valuations which was reflected in XFLT’s price.
Conversely, we saw the price of XFLT quickly retract when interest rates started to get aggressively hiked throughout 2022 and 2023. As the federal funds rate rose to new heights, the cost of debt on the balance sheet become more of a burden and put strain on borrowers that did have the appropriate cash flow buffers. Following this same concept, I strong believe that future interest rate cuts can serve as a positive catalyst for both the price and portfolio value of XFLT. Lower rates can make it a bit less difficult for valuations to grow since interest costs would be decreased, and it can also unlock higher volumes of borrowers for XFLT to utilize as a source of portfolio growth.
It seems like recent economic data is starting to lean towards the probability of interest rate cuts happening by the end of the year. The Fed kept rates unchanged throughout 2024 as they awaited more data to roll in around consumer spending, inflation levels, and the strength of the labor market. However, the unemployment rate has been steadily increasing over the last twelve months and now sits at 4.3%. Similarly, the inflation level has now trended downward for four consecutive months. As of the latest July data, the inflation rate has decreased down to 2.9%, which is getting closer to the Fed’s 2% target.
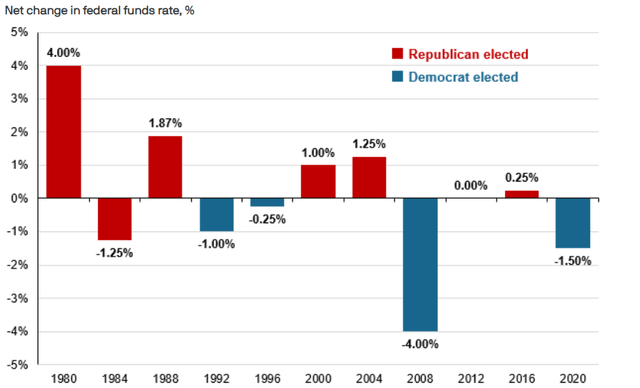
Lastly, we still have the US Presidential elections upcoming at the end of 2024. I anticipate this creating a market environment filled with higher levels of uncertainty and volatility as investors await the outcome. Data compiled by JPMorgan shows that the Fed has implemented changes in the federal funds rate during election years more often than not. For instance, 2012 was the only election year over the last forty-year time span where rates were left unchanged. While this doesn’t guarantee that interest rates will happen this year, it is a great data point to reference.
Therefore, accumulating shares of XFLT at these levels may be attractive. As rates are cut, the underlying portfolio investments may rise in value. XFLT should be able to capture this growth and grow its NAV as conditions start to improve. In addition, I believe the fund trades at an attractive price to NAV relationship.
Valuation
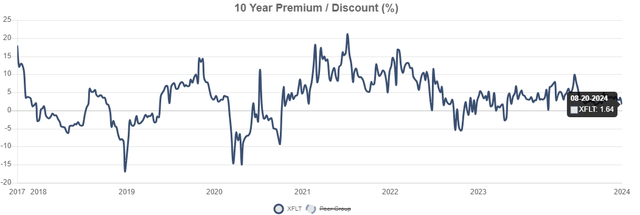
Since XFLT operates as a closed end fund, the price can vary from the actual value of the fund’s net assets. As a result, we can see the varying price to NAV relationship since inception. XFLT currently trades at a very slight premium to NAV of 1.6%. For reference, the price traded at an average higher premium to NAV of 4.8% over the last three-year period. Keep in mind, the fund has never really had the chance to operate under normal interest rate environments, and I think that conditions will be improving starting in 2025 and beyond. When the price peaked in 2021, the premium reached as high as 20%. This peak was during a time of interest rates that sat at near zero levels.
While I do not anticipate the rates going that low again since there is no need for that kind of economic stimulus, I do think that lower interest rates will send the price higher and increase the premium. Rates were also being cut between 2019 and 2020, right before the pandemic happened. If you look at 2019’s price to NAV line above, you will see that the premium steadily increased during that time frame as well. Therefore, it isn’t too far-fetched to anticipate lower rates causing XFLT’s to move upward, since the underlying assets will have more breathing room for growth.
Additionally, accumulating shares at this discounted price level would allow you to collect a higher level of distribution income. Buying into XFLT right before the price appreciates would allow you to capture total returns comprised of both income and capital appreciation, as opposed to just income if you buy in at a later date.
Dividend & Risk
As of the most recently declared monthly dividend of $0.085 per share, the current dividend yield sits at 14.9%. This high distribution rate can be highly appealing to income investors since it requires less upfront capital investor to generate a sizeable income stream when compared to more traditional ETF alternatives. There are plenty of sources for an investor to obtain high-yielding income from their investments, but very few asset classes match the distribution that can be returned from XFLT.
For a comparison, here are the annual distributions an investor would receive from a mix of different asset classes. While they all have different underlying strategies, sector exposures, and structures, it’s a good illustration of why these riskier high-yielding assets are attractive. Not all investors have the luxury of committing time to a long-term investment to obtain their returns. An investment of $100,000 in the following assets would yield:
- XFLT: $14,900 in annual dividend income.
- Liberty All-Star Equity (USA): A closed end fund with a dividend yield of 10.4% would result in annual income totaling $10,400.
- VanEck BDC Income ETF (BIZD) A business development company ETF with a dividend yield of 11.3% would result in annual income totaling $11,300.
- Vanguard Real Estate Index ETF (VNQ): An ETF with diverse real estate exposure that has a dividend yield of 3.8% would produce $3,800 in annual income.
- SPDR S&P 500 ETF (SPY): An S&P 500 fund with a dividend yield of 1.22% that would produce $1,220 in annual income.
The dividend history since the fund’s inception indicates a steady distribution. The distribution was cut in 2020 in reaction to the pandemic related market drop but has since been increased above its pre-pandemic levels. This prompted me to take a look at how the distribution is broken down. According to CEF Data, the distribution has been funded by net investment income produced by the underlying assets within. It seems like there has not been an updated distribution breakdown provided by XFLT, with the last one being issued for the 2022 tax year.
However, I did review the last 2023 annual report and saw that no return of capital was used since 2022. In 2023, the distribution was fully supported by net investment income as well. This is reassuring to see because over reliance on return of capital can stunt the fund’s NAV growth and result in a deteriorating share price over time. However, it should be noted that the distributions received from XFLT are classified as ordinary dividends, which have less favorable tax consequences.
Since XFLT remains highly sensitive to interest rate fluctuations, a scenario where the federal funds rate is not cut would likely cause the share price to remain suppressed or fall in value. The underlying assets within XFLT’s portfolio are more sensitive to these interest rates, and higher rates may cause the rate of defaults to increase within the portfolio. This would cause a negative impact on XFLT’s net investment income per share. A drop in earnings may cause the need to have the distribution reduced to offset this.
Takeaway
In conclusion, I maintain my buy rating on XFLT as future interest rate cuts will possibly serve as a positive catalyst for growth in both price and underlying valuation of portfolio investments. Lower rates would provide some relief to borrowers on a floating interest rate by freeing up capital that can be used to fuel growth or paydown debt more aggressively. In addition, XFLT currently trades at an attractive price to NAV premium that sits under its three-year average. The distribution remains supported by the fund’s net investment income and can serve as a valuable income focused holding. Although the portfolio of investments is exposed to riskier borrowers, XLFT has been able to provide consistent distribution through this higher interest rate environment.
