Meredith Heil
Intro
We wrote about Weis Markets, Inc. (NYSE:WMK) back in May of last year when we recommended investors did not buy into the latest down move in the stock. It was the right call at the time considering the stock is down roughly 3% over the past 13+ months whereas the S&P has been able to return over 33% respectively (significant opportunity cost). The reason is that there was a significant change in investor sentiment post the release of the company’s first-quarter earnings numbers for fiscal 2023 in May of last year. Net income for that particular quarter fell by almost 18% to come in at $25.81 million as elevated inflation continued to significantly impair the company’s margins.
Fast-forward twelve months, and we witnessed another contraction in net income for the first quarter of fiscal 2024 (Earnings announced on the 8th of May last). Although the GAAP EPS of $0.49 per share beat expectations by $0.08 per share, net income still stooped to $23.17 million over the same period of 12 months prior (10.3% decline). This means Weis Markets’ GAAP income has fallen by over $8.2 million (26%+) over the past 24 months, which brings home how serious the supermarket retailer growth problems have become.
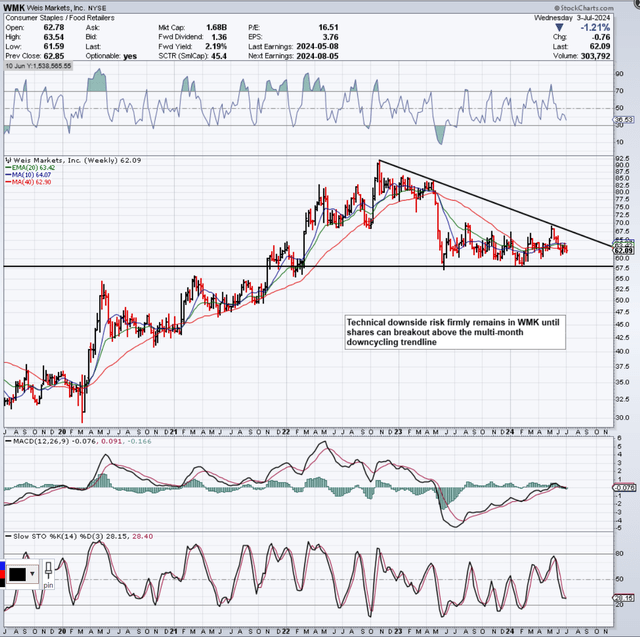
Although the retailer continues to generate solid cash flow and runs a debt-free balance sheet (allowing valuation multiples to improve somewhat over the past 12 months), shares remain in a precariously dangerous technical position, as we see below. Stagflation has been the order of the day over the past 13 months or so, but the technical risk here is that if shares fell through underside support, we could easily have a bearish descending triangle in play as depicted below. Furthermore, given the height of the triangle ($30+ per share), clear downside risk remains evident in Weis Markets until the potential bearish triangle can be negated entirely with a corresponding upside breakout.
Weis Markets Technical Chart (Stockcharts.com)
Valuation Improving But Still Not At Bargain Basement Levels
The CEO stated on the recent earnings call that the company fully intends to invest through the downcycle to generate profitable sales.
We plan for record investments in 2024 when we will begin the construction of six new stores which we expect to open in 2025,” said Mr. Weis. “In addition, we have planned 11 major store remodels and 15 minor store remodels along with five new fuel centers. We will also continue to make sizable technology investments across the Company which help us drive profitable sales.”
As mentioned, the sustained generation of positive cash flow coupled with a debt-free balance sheet means the company has the resources to do the above. Furthermore, Weis Markets’ valuation has become more attractive compared to historic averages, although the stock is by no means heavily undervalued as we see below
| Valuation Multiple | Trailing 12-Month | 5-Year Average |
| Price To Earnings (GAAP) | 16.51 | 15.55 |
| Price To Sales | 0.35 | 0.38 |
| Price To Book | 1.20 | 1.33 |
| Price To Cash-Flow | 7.33 | 7.99 |
Therefore, let’s try to stamp an accurate valuation on WMK by using the popular dividend discount formula below. There is no guarantee that the above-mentioned investments will work, but WMK has paid out a dividend to its shareholders for the past 34 years, so we can use this associated data in our valuation calculation. Furthermore, the formula below delves into Weis Markets’ profitability trends (Such as ROE) which are key in any valuation modeling analysis.
Dividend Discount Model
The formula we will use for our analysis is the following.
Dividend Discount Model (Wallstreetmojo.com)
Where EDPS = ‘Expected Dividend Per Share, CCE equates to the company’s cost of equity & DGR denotes Weis Markets’ Dividend Growth rate.
To calculate EDPS, we must first calculate the sustained dividend growth rate for the company. To do this, we multiply the company’s trailing retention ratio (0.33) by Weis’ trailing return on equity (7.47%). Although, as we know, Weis has kept the quarterly payout the same since November’2022 ($0.34 per share per quarter or $1.36 annually). Multiplying ROE by the retention ratio gives us a DGR of 2.5%. This low DGR is not an ideal start, as we want the difference between Weis’ cost of equity & corresponding DGR to be as small as possible to boost the stock’s valuation in our calculation. This means the expected Dividend Per Share turns out to be $1.39 per share.
Cost Of Equity
A company’s cost of equity gives a key insight into valuing a company. Cost of Equity denotes investors’ required rate of return. As we see from the formula below, it takes the market’s ‘risk-free-rate’, the company’s volatility & US derived ‘Equity Risk Premium‘ (Denotes The Absolute minimum return expected in the investment) all into account.
Cost of equity = Risk-Free Rate + (Beta)(Equity Risk Premium)
We are using the 10-year US Treasury Bond (4.36%) as our ‘risk-free rate’, 0.45 for Beta & a third-party calculation (Damadoran Equity Risk Premium – 4.6%) for ‘Equity Risk Premium’ in the calculation.
Plugging our values into our formula
Projected Valuation of WMK = $1.39 / 0.0643 – 0.025 = $35.37 per share
Conclusion
To sum up, we see that our calculated valuation ties in with what we warned about above concerning Weis Market’s potential descending triangle pattern. Shares of the retailer are trading at approximately $62 a share. Nevertheless, valuation modeling exercises are not entirely accurate, which is why we are maintaining our ‘Hold’ rating on the retailer for the time being. If underside support, however, were to be breached (on strong selling volume), we may place a position on the short side in due course. We look forward to continued coverage.

