PhonlamaiPhoto/iStock via Getty Images
Barcelona-based EV charging provider Wallbox (NYSE:WBX) has seen brighter days. Wallbox stock nosedived more than 22% last year while dramatically underperforming the S&P 500. The steep drop stems from the growing pains in the EV sphere, driven by fierce competition, limited charging infrastructure, and geopolitical and economic headwinds. However, with a potential recovery beginning next year and anticipated interest rate cuts, the EV market and its sister concerns are poised for a rebound. Additionally, with a fair value model grounded in realistic growth projections, Wallbox seems undervalued at current prices.
Company And Competitive Overview
Wallbox is a Barcelona, Spain-based EV charging company involved in designing, producing, and distributing EV charging solutions for residential, commercial, and public use. Its operations span 117 countries, Europe-Middle East and Asia, North America, and Asia-Pacific regions. Additionally, a snapshot from its Q2 report highlights a massive total addressable market (TAM), which stands at a mighty $102 billion. Considering it posted $158 million in sales last year, it’s merely scratching the surface.
Wallbox Q2 Corporate Earnings Deck (Investor Relations Wallbox)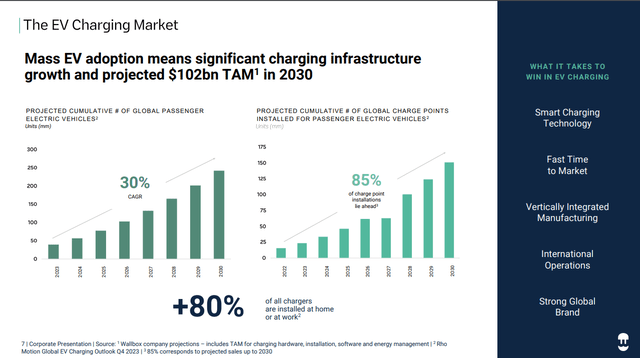
Wallbox rode the 2021 EV SPAC wave, going public on October 4, 2021, through a merger with shell company Kensington Capital Acquisition Corp. II. Trading at $8.60 on its first trading day, the stock quickly surged to its all-time high closing price of $18.50 within a month of going public. However, the stock now trades at just $1.37, a mere fraction of its all-time highs, shedding over 85% of its value since then. Additionally, with a market cap of under $350 million, Wallbox is at the lower edge of the small-cap range.
Wallbox Regional Revenue Breakdown (Wallbox Corporate Filings)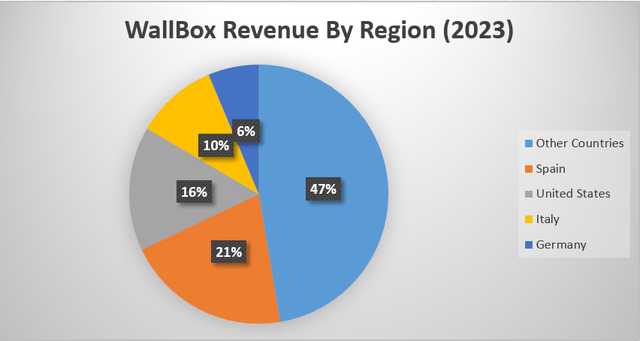
Furthermore, Wallbox currently generates roughly 90% of its sales from its comprehensive product portfolio and the rest from services. The pie chart above shows that it derives the largest revenue share, 47%, from “Other Countries,” reflecting its deep presence across multiple regions. Spain was the second-largest contributor, generating 21% of sales, indicating strong local demand. The United States comes in at 16%, highlighting significance, followed by Italy and Germany at 10% and 6%, respectively.
Its powerful product lineup is crafted to cater to residential, commercial, and public EV charging needs. In meeting the needs of its residential customer base, Wallbox Pulsar Family and Quasar 2 (BiDi-DC) deliver 7-22 kW of power. Likewise, the Pulsar Pro and ABL eM4 effectively cater to commercial charging needs. Additionally, its public charging solutions in the Hypernova and Supernova DC offer 150-400 kW and 60-220 kW, respectively. Also, the company provides software solutions such as the Wallbox App for energy management, Electromaps and EVectrum for fleet management, and Sirius for grid integration with renewable energy.
Wallbox Q2 Corporate Earnings Deck (Investor Relations Wallbox)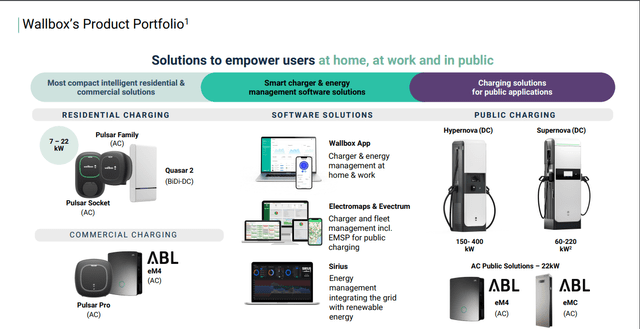
Wallbox operates in a hotly competitive niche going head-to-head with powerhouses like Tesla (TSLA), its vast Supercharger network, and ChargePoint (CHPT), with its networked charging solutions. Emerging players like EVgo (EVGO) and Electrify America have been expanding their fast-charging infrastructure, while newer players in the U.S. and China continue driving sector innovation. Also, these companies flaunt larger market caps and stronger resources for R&D, marketing, and partnerships with top automakers, outpacing Wallbox. Nonetheless, Wallbox continues carving its niche through innovations in its bidirectional chargers and other innovations, backed by a strong client base, as shown below.
For instance, Wallbox’s Quasar 2 has advanced features and functionality, which give it an edge over its competition. Unlike typical chargers, Quasar 2 can seamlessly ensure continuous power supply, effectively switching between charging the vehicle and powering a home during an outage. Moreover, it can assess the charging state of a connected vehicle and adapt accordingly, offering real-time information through its intuitive interface. The charger facilitates energy savings by letting users power their homes during peak periods and recharge their vehicles when electricity rates are cheaper. Its automatic transition between grid and EV power and smart energy management features provides a reliable and user-friendly experience.
Wallbox Q2 Corporate Earnings Deck (Investor Relations Wallbox)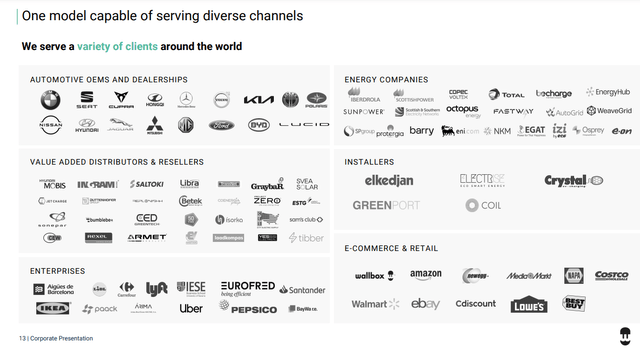
2022-2023: A Dull Chapter In EV Growth
The EV market was under major duress last year and into early 2024, in contrast to the strides made in yesteryears. Heightened interest rates, a turbulent Chinese economy, and European subsidy cuts led to the sector’s slowdown. Consequently, the bears were quick to suggest that the industry is transitioning into a mature phase, following the explosive numbers posted in previous years.
Global EV sales came in at 14.2 million units last year, marking a 35% increase from 2022. Though strong on paper, the 35% increase was remarkably slower than the massive surge of the 55% increase in the previous year. The stellar expansion in 2022 was linked to a post-pandemic economic rebound, higher government subsidies, and growing consumer enthusiasm for EVs.
From a regional perspective, we see contrasting dynamics in the European and North American EV markets over the past couple of years. In Europe, despite the 17.3% increase in EV registrations last year, the sector was up against multiple headwinds. Subsidy reductions in France and the termination of incentives for businesses and private buyers in Germany significantly impacted the market. Surprisingly, Norway, one of the bellwethers in the European EV scene, ended VAT exemptions for plugins. Thus, 2023 proved lackluster for European EV players, who expected a healthy rebound from the modest 15% year-over-year (YOY) growth in 2022. Meanwhile, in the USA, EV adoption has been significantly better, with deliveries growing by 48% last year, building on a 50% bump in 2022. However, even with the Inflation Reduction Act incentives, the expected boost in EV adoption didn’t materialize as anticipated.
The trend hasn’t changed much as we enter the back-end of 2024. In the first half of the year, global EV sales hit 7 million units, a 20% YOY increase. China led the charge with 4.1 million units sold, a 30% bump from last year, while North America saw a 10% uptick with 0.8 million units. Additionally, Charles Lester, Lead EV Data Analyst at Rho Motion, noted that Europe’s sluggish performance led to a 5% reduction in the firm’s 2024 global EV sales forecast, set at 16.6 million units.
2025: The Year Of The EV Resurgence?
Following two forgettable years, 2025 could potentially be a comeback moment for the EV space. A favorable shift in interest rates and stricter regulations could likely spark a major revival in EV markets worldwide.
From 2022 to 2024, central banks in the U.S. and Europe pushed interest rates higher to control rising inflation. In the U.S., we saw the Federal Reserve raising rates to a 23-year-high, hovering in the 5.25% and 5.5% range as of mid-2024. Similarly, the European Central Bank (ECB) increased rates to an all-time high of 4%.
However, recent developments show that the long-awaited rate cuts are finally on the horizon. With Europe’s inflation outlook improving, the ECB recently cut rates to 3.75%, and President Christine Lagarde’s optimistic remarks suggest further easing could be on the way.
Moreover, in the U.S., Federal Reserve Chair Jerome Powell commented recently that the “the time has come” for potential rate cuts. The Wall-Street punditry expected a reduction of 0.25 to 0.5 percentage points as early as this month.
This easing of monetary policy will naturally lead to a reduction in borrowing costs, spurring demand for EVs. James Frith, head of Volta Energy Technologies’ European operations, noted that high interest has significantly weighed down EV sales; with rates easing, a natural recovery in EV growth is expected. Moreover, introducing more stringent EU car CO2 targets in 2025 could be a major growth catalyst for EV sales in the region. Additionally, automotive companies previously looking to maximize profits on traditional vehicles will now have to scale EV production under new regulations.
Meanwhile, in the U.S., the EV market is positioned for an impressive showing. Legacy Automakers like General Motors (GM) project substantial growth ahead, with plans to potentially produce upwards of 200,000 to 300,000 Ultium-based EVs this year, a colossal increase from the 5,800 units sold in Q1. Additionally, the International Energy Agency expects U.S. fully electric vehicle sales to rise from 1.1 million in 2023 to 2.5 million in 2025.
Promising Results, Yet Profitability Remains Elusive
On the back of a positive 2025 backdrop, Wallbox delivered a superb performance in Q2. It was its strongest quarterly showing yet, generating €48.8 million in sales, a spectacular 48% increase YOY and 13.2% on a sequential basis.
Wallbox Q2 Corporate Earnings Deck (Investor Relations Wallbox)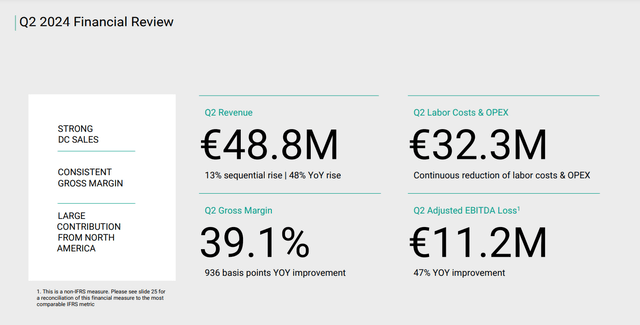
The North American market stood out for the firm, with revenue growth blowing past the 65% mark in AC and DC sales. These numbers are encouraging for Wallbox, considering how resilient the U.S. EV market has been in overcoming the economic headwinds. Additionally, key Q2 highlights of the quarter include the launch of Wallbox’s most powerful DC fast charger yet, the Supernova 220, and a significant contract win with Generac.
On the bottom-line front, the firm improved its gross margins to 39.1%, up 936 basis points from last year, and a 47% improvement in adjusted EBITDA. June was a breakthrough month for the company, where it achieved its first month of positive adjusted EBITDA, which aligned with its future profitability goals.
Despite delivering extraordinary results, Wallbox still has plenty of work to do to improve its bottom-line positioning. Last year, its net loss came in at a concerning $123.7 million, an alarming 84% decline from the previous year’s $67.2 million. That’s a bummer, considering it made decent headway in 2022, with a 74% improvement from its 2021 net losses of 254.7 million.
Unsurprisingly, the mounting net losses have severely hampered its financial flexibility. Its cash balance is just $118 million, against its total debt load of $271.9 million. Moreover, this leaves the company with a rather short cash runway of just 10.3 months, based on its current reserves and last year’s net losses.
Cash Flow Statement (Seeking Alpha) (Seeking Alpha Financials Page)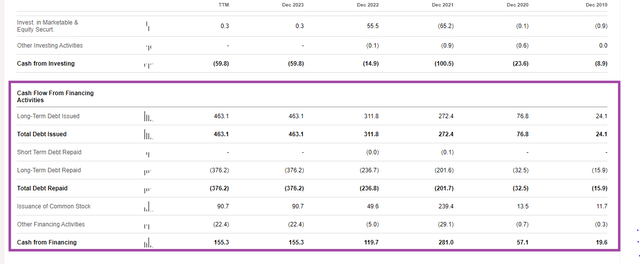
To better understand how the EV charging play manages its cash runway, here’s a look at its cash flows from financing activities. Over the past five years, we can see that it has consistently issued new shares and debt in financing its operations. Last year, the company issued $463.1 million in long-term debt while repaying $376.2 million. It also raised $90.7 million through common stock issuance, which amounted to a net cash inflow of $155.3 million from financing activities. Moreover, we also know from its Q2 report that it received a $45 million investment from Generac and other investors. Nevertheless, despite shoring up its financials through equity and debt, the firm’s precarious position is evident. It attracts an Altman-Z score of -0.49, placing it firmly in the distress zone.
Fair Value Model Highlights Considerable Upside Potential
Building a fair value model for Wallbox stock was challenging, particularly due to its track record of posting negative free cash flows. Nevertheless, with analysts forecasting a shift towards positive operating cash flow per share, this metric formed the backbone of my analysis. Moreover, based on realistic growth projections for the EV charging space, Wallbox stock offers a substantial upside in its base case projections.
It is important, though, to consider that the analysis is based on multiple assumptions, including future growth rates, discount rates, and terminal value estimates. These assumptions are unlikely to capture the full extent of the market choppiness, competitive pressures, and the company’s operational hiccups. Additionally, external economic factors, industry-specific risks, and technological shifts are also elements that can significantly impact results.
The first step involved calculating the weighted average cost of capital, or the WACC. In doing so, I calculated Wallbox’s effective tax rate by dividing its income tax expense of -$0.80 million by its pre-tax earnings of -$124.50 million, which came in at 0.64%. Next, the book value of its debt balance was assessed by summing up the current and long-term debt, totaling $229 million. Also, given that Wallbox has been listed for approximately 2 years and 10 months, a beta of 1 was used, which reflects its volatility against the market.
For the risk-free rate, I refined the 10-year U.S. bond yield using Exponential Moving Averages (EMAs) combined with a Simple Moving Average (SMA), resulting in an RF rate of 3.57% after applying weighted averages. Additionally, based on historical S&P 500 returns since 1957, averaging 10.48% annually, including dividends, I calculated the equity risk premium.
Wallbox Beta Calculation (Author’s Own Compilation Using Historical Data)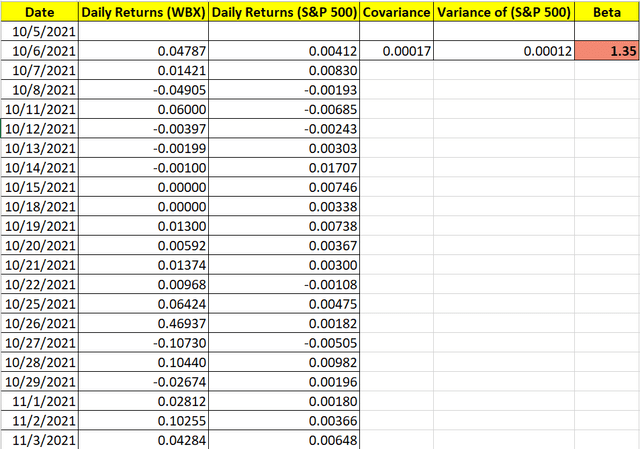
In evaluating Wallbox’s risk, I used nearly three years of its stock data alongside the S&P 500, calculating daily returns. The covariance between Wallbox and market returns and the variance of the market returns resulted in a beta value of 1.35. It shows that Wallbox stock is 35% more volatile than the market, indicating it experiences larger fluctuations compared to the market.
The final snapshot of my Excel model shows an after-tax WACC of 10.63%, using a market cap of $347.5 million.
Wallbox WACC (Author Compilation)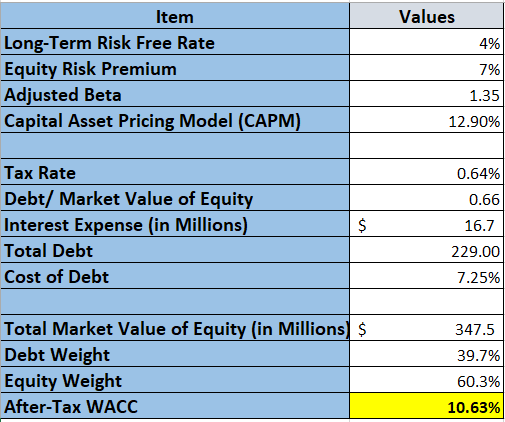
I used the analyst estimates for Wallbox’s 2025 operating cash flow of 3 cents per share for the FCF analysis. Moreover, growth rate selections were influenced by insights from Precedence Research, which forecasted the global EV charger market to expand at a dynamic 28% CAGR from 2024 to 2034 to $174.09 billion.
- Growth Rates:
- 2026-2028: Base Case: 28%, Bear Case: 20%, Bull Case: 35%
- 2029-2031: Base Case: 25%, Bear Case: 15%, Bull Case: 30%
- 2032-2034: Base Case: 20%, Bear Case: 10%, Bull Case: 25%
Wallbox FCF Base Case (Author Compilation) Wallbox FCF Bear Case (Author Compilation) Wallbox FCF Bull Case (Author Compilation)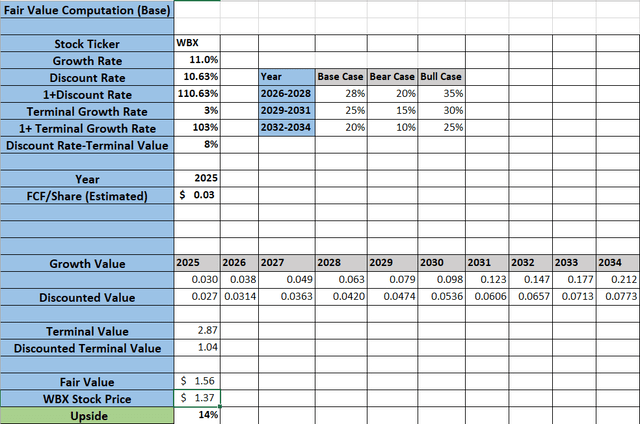
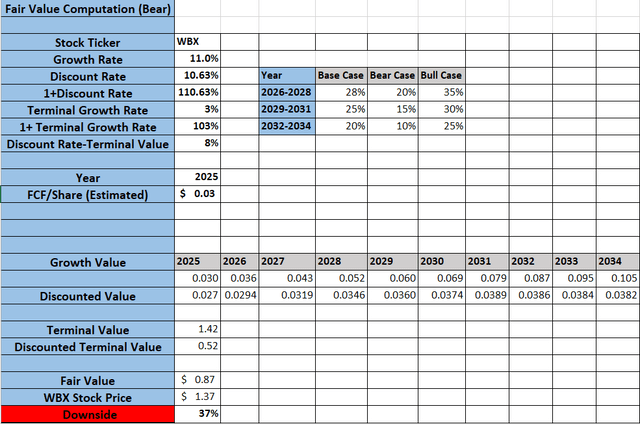
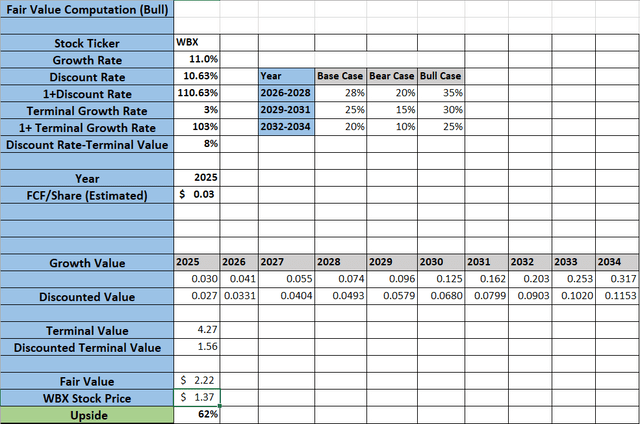
The selected growth rates across the three different scenarios account for unique realities and market conditions Wallbox might face. Based on industry forecasts and the company’s recent performance, the base case assumes steady and realistic growth. The bear case is grounded in more major obstacles leading to modest growth, while the bull case underscores the firm’s potential for higher growth, influenced by favorable market dynamics.
Based on the calculations, we can see that the base case computation points to a considerable 14% upside from current prices. Conversely, the bear case points to a 37% drop from current levels, while the bull case indicates a significant potential surge of 62%. It’s important to consider that none of the results met Wall Street’s high expectations of over 180% upside to $4.13.
Risks To The Thesis
Despite Wallbox’s promising growth trajectory and oversold stock, which signals the potential for significant growth, multiple risks weigh down its bull case. Its dependence on a rebounding EV market, along with the intense competition in its niche and persistent economic challenges, suggests a bumpy road ahead.
Firstly, most of the stock’s bull case hinges on whether the EV market can recover next year. While there are strong arguments for a recovery, there are plenty of reasons to doubt it might come to fruition. Some analysts feel that high vehicle prices, lower incentives, and a slower-than-expected adoption of EVs will hinder a rapid recovery. For instance, given the challenges, GM indicates that the EV market is evolving much slower and does not expect to meet its 2025 production targets.
Moreover, Wallbox’s bidirectional chargers may be somewhat of a novelty at this point, but it needs to continue innovating to stay relevant in its niche. As mentioned earlier, Wallbox faces intense competition in its niche from pure-play EV charging companies and automotive giants. Its competition is investing heavily in its charging networks, many of which are set to include bidirectional charging capabilities soon. Additionally, several automotive companies, including GM, Kia, and Rivian Automotive (RIVN), offer bidirectional charging capabilities in their vehicles and are developing their charging infrastructure. This not only adds to their market positioning, but also adds pressure on players like Wallbox. Hence, if Wallbox fails to innovate quickly and effectively, it will lose market share to better-equipped competitors.
Final Word On Wallbox Stock
Despite Wallbox stock’s challenges over the past couple of years, its current valuation points to a considerable upside potential. The expected recovery in the EV market next year, backed by interest rate cuts and stricter regulations, could offer a strong tailwind for Wallbox. Moreover, its powerful product portfolio, growing global presence, and ongoing tech innovations position it well for future expansion. For those with a long-term perspective that can stomach the volatility, Wallbox could be poised for a superb rebound, making it attractive at current levels.

