
Brad Booth
Top Growth & Dividend Long-Term Stocks For Mid-Year 2024
The Top Dividend Growth stock model expands on my doctoral research analysis on multiple discriminant analysis (MDA) adding new complexities with these top picks. Research shows that the highest frequency of large price breakout moves is found among small-cap stocks with low trading volumes, offering no dividends and delivering higher than average risk levels.
Additionally, only one stock of the 15 largest Mega Cap stocks in the market producing enormous average returns +61.5% YTD offers a dividend yield above 2%.
The challenge with the Top Dividend & Growth model is to deliver a combination toward optimal total return with characteristics like high dividends that typically reduce the frequency and magnitude of price breakouts but deliver more reliable growth factors for higher profitability longer term.
Current Market Conditions
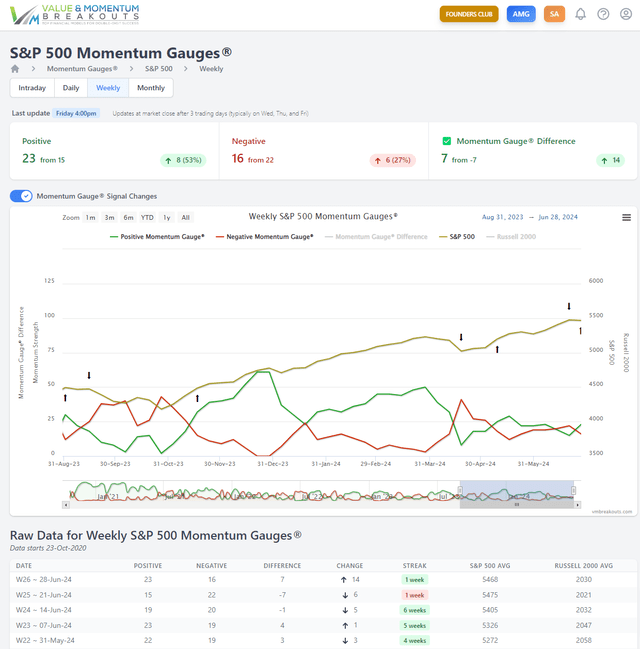
A quick review of the current market conditions shows the Weekly Market Gauges of 7,500+ stocks still in a negative signal for 2 consecutive weeks, while the large cap S&P 500 weekly gauges have turned positive again. Warning signals are numerous as the Fed keeps rates unchanged at the highest levels in over 22 years. The market returns continue skewed at record levels, favoring the largest mega caps stocks, while the small-cap Russell 2000 index briefly dipped negative for the year this past week. I have published several recent signal articles cautioning readers:
The S&P 500 weekly gauges turned negative in the prior week as NVIDIA (NVDA) pulled back -12% from all-time highs. This mega cap giant continues to greatly skew the major indices as the largest and most heavily weighted stock in the world with the fastest trillion dollar market cap gains ever.
vmbreakouts.com
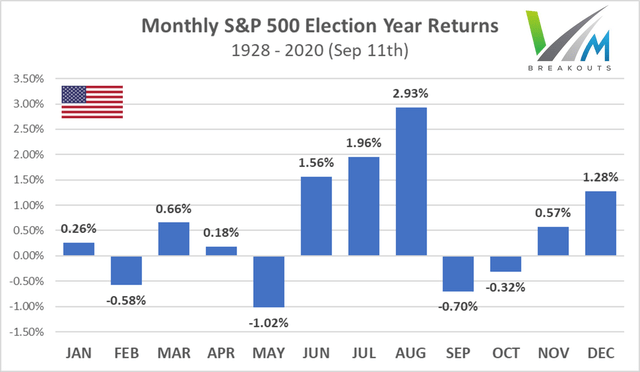
The cyclical pattern for the S&P 500 during election years since 1928 shows that the summer months have on average been the best months of the year. Of course, every year has its own unique economic conditions, and 2024 is unlike any year before it.
vmbreakouts.com
January Dividend Adjusted Returns vs. S&P 500
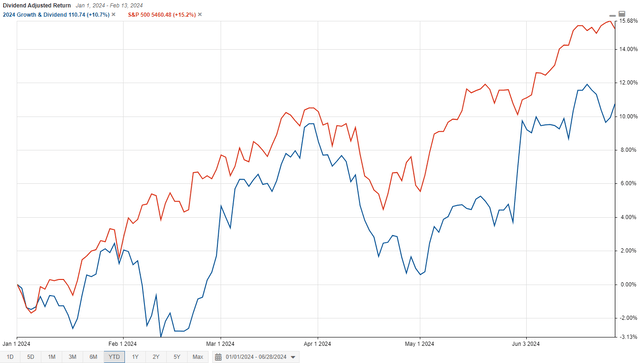
Additionally, the 2024 January Growth & Dividend portfolio is up 10.7% YTD adjusted for dividends, with the S&P 500 up 15.2% shown below. Consider that most of the mega cap technology giants skewing the market to record highs do not offer large dividends or any dividends in many cases and are not eligible for this portfolio. Only 1 stock (JPM) among the 15 largest Mega Cap stocks in the market offers dividends above 2%.
StockRover.com
Instructions: readers are free to buy/hold any stocks for the one-year and two-year measurement period of each portfolio. You may hold longer, follow the Momentum Gauge signals, or update your Growth & Dividend portfolios with newer selections. You can consider each January portfolio as the main annual selection, but I also release 5 bi-monthly bonus selections in 2024 for you to consider throughout the year to refresh your portfolio.
Selections: Each monthly selection portfolio consists of 5 stocks above a minimum $10 billion market cap, $2/share price, 500k average daily volume and a minimum 2% dividend yield. The population of this unique mega cap segment is approximately 330 stocks out of over 7,800 stocks across the US stock exchanges. While these stocks represent less than 5% of available stocks, their market cap exceeds $19 trillion out of the approximately $33 trillion (57.6%) of the US stock exchanges. Efforts are made to optimize total returns on the key MDA price growth factors (fundamental, technical, sentiment) for the best results under these large cap constraints with high priorities for dividend growth and dividend yield.
Top Growth & Dividend Stock For July 2024
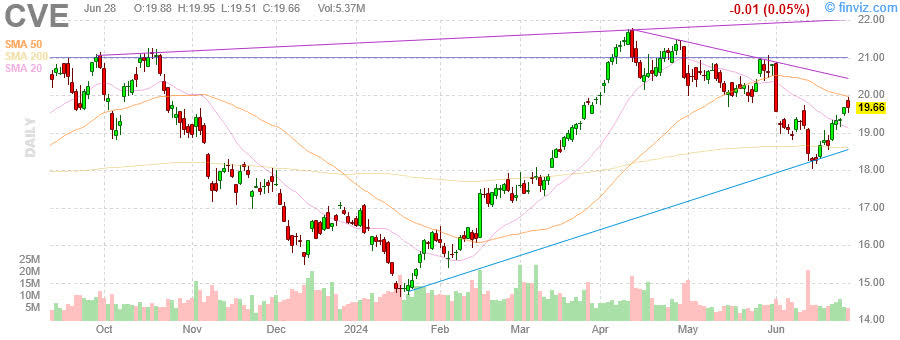
Cenovus Energy emerges from the discriminant analysis of fundamental variables and dividend analysis as one of the top dividend stocks from the July selection portfolio for strong long-term gains according to a combination of the MDA value and momentum variables.
Cenovus Energy (CVE)
FinViz.com
Multiple Discriminant Analysis MDA chart of more 75 variables
Cenovus is showing early breakout conditions with Segment 6 positive acceleration signal on Friday for the first time in nearly a month. You can learn more about my research in the SA webinar.
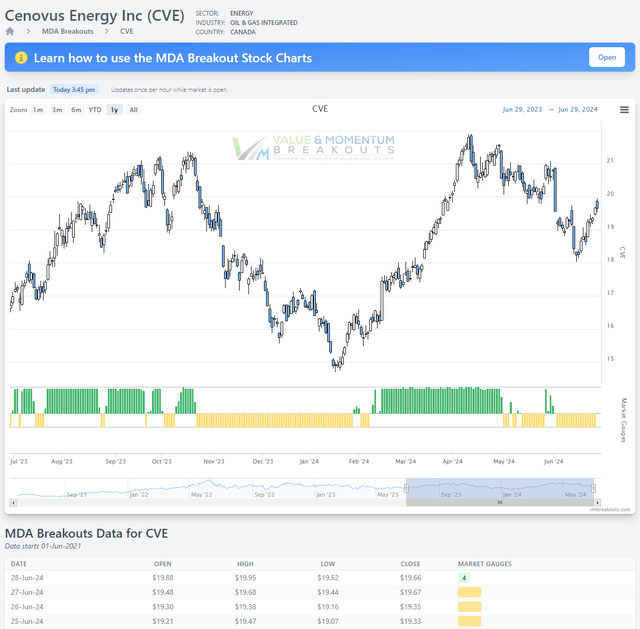
VMBreakouts.com
(Source: Company Resources)
Cenovus Energy, Inc. is a Canadian-based integrated energy company, which engages in the provision of gas and oil. It operates through the following segments: Upstream, Downstream, and Corporate and Eliminations. The Upstream segment refers to operations of oil sands, conventional, and offshore. The Downstream segment operates the Canadian and U.S. refining. The Corporate and Eliminations segment includes the corporates costs for general and administrative.
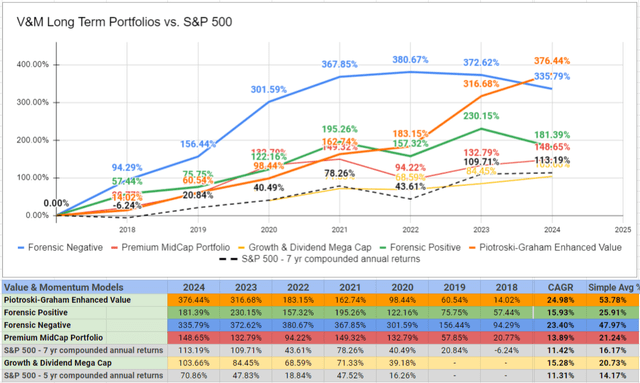
Prior Returns 2020 to 2024 YTD
These large cap dividend selections are heavily affected by Federal Reserve fund rates, corporate dividend decisions, and the competing yields in the treasury markets. The January Growth & Dividend selections are beating all the major Hedge Fund averages since inception. Returns can be enhanced by following the Momentum Gauge signals and avoiding major downturns.
vmbreakouts.com
*Returns to date on the Growth & Dividend selection model are not adjusted for the large dividends from each stock.
Prior Long-Term Gainers to Consider
This section is a brief review of strong prior selections that have delivered on the long-term growth forecast. Many of these stocks are in more than one monthly selection portfolio, as the high criteria standards often produces a small pool of strong candidates with frequent overlap.
These 10 prior selections are significantly outperforming in the long term with strong dividends. More details are available in their original selection articles.
| Symbol | Company | Price | Return from Selection |
| (LLY) | Eli Lilly And Co | 905.38 | 552.67% |
| (KLAC) | KLA Corp | 824.51 | 473.61% |
| (TSM) | Taiwan Semiconductor Mfg. Co. Ltd. | 173.81 | 222.83% |
| (AMP) | Ameriprise Financial, Inc. | 427.19 | 204.98% |
| (COP) | ConocoPhillips | 114.38 | 171.69% |
| (VST) | Vistra Corp. | 85.98 | 162.78% |
| (TRGP) | Targa Resources Corp. | 128.78 | 122.23% |
| (INFY) | Infosys Ltd ADR | 18.62 | 101.73% |
| (HPQ) | HP Inc. | 35.02 | 100.92% |
| (GRMN) | Garmin Ltd. | 162.92 | 100.74% |
There is overlap since 2020 among different monthly portfolios. The recurrence of selection may be a strong indicator of long-term success.
*Returns to date on the Growth & Dividend selection model are not adjusted for the large dividends from each stock.
Conclusion
These stocks continue a live forward-testing of the breakout selection algorithms from my doctoral research applied to large cap, strong dividend growth stocks. None of the returns listed above include the high dividend yields as part of the performance, and would further increase total returns for each stock. These monthly top Growth & Dividend stocks are intended to deliver excellent long-term total return strategies, leveraging key factors in the MDA breakout models used in the small-cap weekly breakout selections.
These selections are being tracked on the V&M Dashboard Spreadsheet for members and enhancements will continue to optimize dividend, growth, and higher breakout frequency variables throughout the year.
All the very best to you!!
JD Henning, PhD, MBA, CFE, CAMS
Editor’s Note: This article discusses one or more securities that do not trade on a major U.S. exchange. Please be aware of the risks associated with these stocks.

