mixmotive
Investing In S&P Global
Earnings season has begun. Amidst thousands of quarterly reports and earnings calls that need to be scrutinized, I will pay close attention to a few sectors, and credit rating agencies are among my top priorities. In this article, we will look at Standard & Poor’s (NYSE:SPGI), one of the latest additions to my portfolio, with a 4% weighting. In fact, in addition to being part of an oligopoly (or, as many think, a duopoly) and having an endurable moat (the company is entrenched, among others, in the sweet spot of debt issuance which is one of the fuels of the economy), it is an extremely efficient and profitable company that I plan on holding for decades. Last but not least, most of its revenue is recurring.
The company has five main segments: Ratings, Global Market Intelligence (data and analytics), Commodity Insights (information and benchmark prices for commodity markets), Mobility, and Dow Jones Indices. The first two segments generate most of SPGI’s revenue, with Ratings and Indices having the highest operating margins. Regarding Mobility, rumors suggest that S&P Global may want to sell it.
After looking at main peer Moody’s Corporation (MCO) with an article last week, it is time to spend a few words on what S&P’s earnings may look like.
S&P Global’s Recent Financials
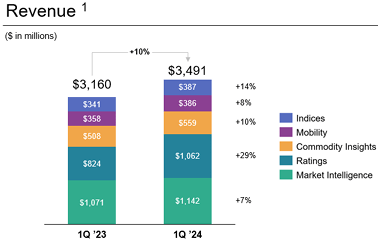
In Q1 2024, S&P Global reported revenue of $3.491 billion, which beat its previous quarterly record by over 10%. The operating margins expanded by 350 bps to 39.7%, creating a very profitable situation for free cash flow generation. As a result, the company declared it would increase its share repurchases totaling around $1.3 billion between Q2 and Q3. Now, this is a big buyback, with almost 1% of the current market cap being repurchased in just six months. Unlike Moody’s, S&P Global felt confident enough to raise its FY 2024 guidance, which we will look at further later in this article.
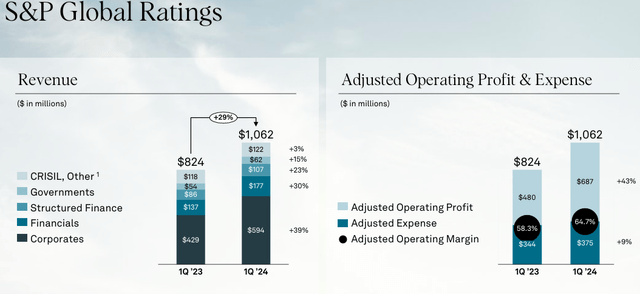
The revenue breakdown shows the same pattern we have observed with Moody’s: Ratings increased impressively (29% YoY).
SPGI Q1 Results Press Release
As said, one of the strengths of S&P Global is its recurring revenue. However, in Q1 2024, subscription revenue increased only 2% to $1.78 billion. What drove the overall growth was transaction revenue, which went up 33%. This makes sense since it is revenue coming from ratings of debt issuance, which doesn’t exactly fall in the category of recurring activity.
This, however, didn’t affect the operating profits of each segment. If we move down to the operating profit of each segment, Ratings reported a 42% increase from $477 million to $679, followed by a 21% increase reported by Commodity Insights.
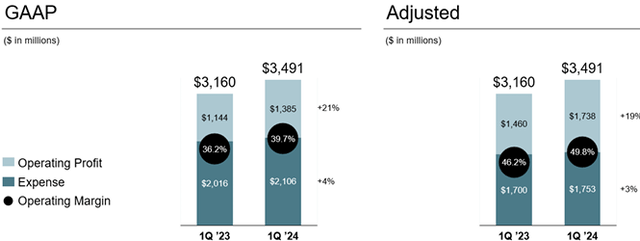
Before we spend a few words on each segment, let’s take a look at the margins reported. The company saw its expenses increase only by 4%, while its operating profits grew 21%.
SPGI Q1 Results Press Release
S&P Global runs a very capital-light business, as such, it’s in a fantastic position to be able to generate billions in free cash flow. In Q1, the company didn’t fall short of expectations and reported that its FCF was $851 million vs. $488 million in the prior-year quarter. This is a 74% increase.
But, enough with the past. This was useful to paint a picture of what just happened. What matters even more is what could be reported in a few days.
I think it will be useful to understand better why Ratings saw such a massive, and to some extent, unexpected growth.
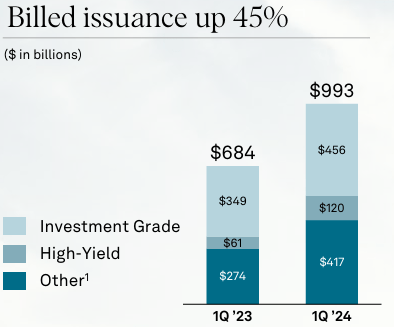
As a matter of fact, favorable market conditions materialized for bank loans and high-risk debt. This was because of reduced spreads because of more available capital. Therefore, many businesses needing to refinance their debt were quick to benefit from this situation and anticipated their financing needs pulling forward from H2 2024 to H1 2024. Moreover, several large M&A deals supported investment-grade issuance. With recent inflation data cooling rate cut expectations to only this year, businesses saw an opportunity starting in late fall 2023 and profited from it. As a result, we have a big increase in billed issuance, as shown below.
SPGI Q1 Results Presentation
This was better addressed by S&P Global’s President and CEO, Douglas Peterson, during the Annual Deutsche Bank Global Financial Services Conference:
The Ratings business had a very strong first quarter as there was a lot of capital that came back into the fixed-income capital availability. And this capital availability meant that the rates for issuance were lower, the spreads were quite lower and there was a lot of issuance across the entire spectrum of fixed income, every single market had a lot of issuances, including also bank loans. So we see that sometimes issuance can be determined by rates and spreads. But in the long run, over time, the most important factor, which drives issuance is economic growth. That’s — if you think about underlying issuance in the Ratings business, it’s going to be driven by, do I have confidence in my business that I can invest and continue to grow my business? Am I confident to do M&A? That’s what drives issuance. Rates and spreads drive timing, but issuance is really driven by confidence in growth.
As a result of these words, we understand two things. On one side, the Ratings business is actually volatile because every quarter there might be different ins and outs that depend on market conditions. On the other side, as the economy grows, it is highly predictable because corporate and government debts are correlated to GDP growth.
Now, because of favorable market conditions, Mr. Peterson did admit what I have briefly described above:
We did see a pull forward in the first quarter from what we expected sometime later this year. We didn’t see a lot of pull-forward from later years, but, over time, almost all issuance ultimately kind of is pull-forward away. People don’t wait until the last minute to refinance their debt. They’re always pulling forward. They pull forward a year, a quarter, three quarters, so I’m not sure about the timing on that, but we saw a very strong first quarter and we’re expecting in the second half of the year, lower levels of issuance given all of the circumstances that I’ve been describing.
S&P Global’s Q2 Earnings Preview
The result on Ratings is seen below: corporate ratings grew 39% YoY, followed by financials (i.e. bank loans).
SPGI Q1 Results Presentation
How does this affect our Q2 forecast? Well, most of this activity picked up speed during Q1 and didn’t seem to be over by March. So, we are probably going to see a strong Q2 for Ratings. Given its weight on the overall revenue mix, the odds are in favor of a nice beat.
This was confirmed by Mr. Peterson during Bernstein’s 40th Annual Strategic Decisions Conference:
We’ve seen very robust issuance in April. May has had robust issuance in non-investment grade as well as bank loans and some structured areas. Investment grade dropped a lot. That slowed down a lot during the quarter.
Investors are seeking high-risk bonds, which is typical of a bull market.
So, given the easy comps, I would not be surprised to see S&P Ratings report growth above 25% for this quarter.
In addition, the company expects its 2024 FCF to be around $4.5 billion, which means we should see a very strong Q2 with over $1.2 billion in FCF. This is particularly important because S&P Global usually returns 85% of its FCF to shareholders via dividends and buybacks.
As said, at the end of Q1, S&P Global raised its FY guidance as follows:

SPGI Q1 Results Presentation
If this guidance is met, SPGI is currently trading at a fwd P/E of 44. This is expensive, there is no way to hide it. However, what matters even more is another aspect which, as far as I see, is the real driver of S&P Global’s outperformance: free cash flow.
S&P Global Valuation
Over the past ten years, the company has been able to grow its FCF at an annual rate of 13.2%. If we factor in the guidance for FY 2024, we actually see the annual rate grow to 13.3%. This has usually been true for S&P Global: over time, its FCF CAGR steadily ticks upwards.
Given the way the business is structured, capex usually ends up in the range between $80 million and $150 million, which is a miniscule portion of operating cash the company is able to generate.
As a result, if I run a DCF for the next five years, I come to a very interesting result. The company’s WACC is 8.75%, the average market return I use is 8%. These are not low values. Many use lower ones in their models. But what I have to consider is the company’s FCF growth, which I expect to be at least 12% per year for the next five years. I then use a perpetual growth rate of 5.5%, just to be conservative. But I personally don’t expect S&P Global to decrease its compounding strength so dramatically in five years.
The result is that a fair value could be just below $570, which gives us 17% upside.

Author, with data from SA
Bear in mind, this is a model and, as such, it hinges on some personal expectations. But do consider these are grounded on what the company has so far delivered. To me, it is almost crystal clear that S&P Global is a great holding long-term.
Considering the possibility of a strong report, I rate the stock as a buy before earnings because it could jump up as investors digest positive news.

