
kefkenadasi/iStock via Getty Images
Signet Jewelers Limited (NYSE:SIG) has been on my watchlist for a couple of months, and following the significant correction experienced by the stock after the last earning release, I was very close to opening a position as it requires very conservative mid/long-term assumptions to underwrite an investment case.
But the Outlook provided by management at the time was and continues to be the reason that prevented me from doing so, and that will be the focus of this article.
There are many issues that can be highlighted and further scrutinized when analysing this Jewellery retailer that serves mainly the US with smaller operations in Canada and the UK. Most of those I would put on the risks category; like the value of its brands when compared to the ones marketed by LVMH (OTCPK:LVMUY) or Pandora (OTCPK:PANDY), the impact of lab grown diamonds on its revenue sustainability or some of the more operational issues that the company has faced in recent years.
In a future article I might address those issues, but first I wanted to post this narrower piece to highlight the more immediate risk of a potential guidance cut in the next earning release that is just a few days away (September 12), as the implications of the materialization of that outcome could be significant for the short-term performance of the stock.
Last Quarter Results and Outlook
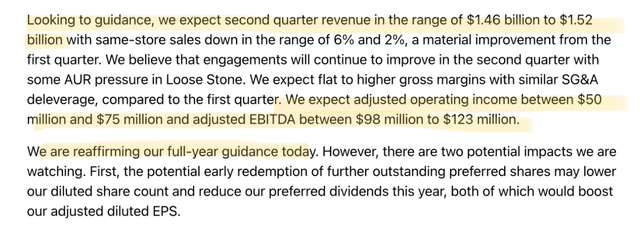
Last quarter results were soft but relatively in line with expectations. Adjusted operating margin came 256 bp below the same quarter of last year and at the same time their guidance for the second quarter implies at the midpoint another margin reduction, this time of 167bp vs the previous year.
But despite these two important negative datapoint, management decided to keep FY guidance unchanged at $6,840 million and $633 million for revenues and adjusted operating income respectively, at the midpoint.
1Q Fiscal Year 2025 Signet earning call transcript
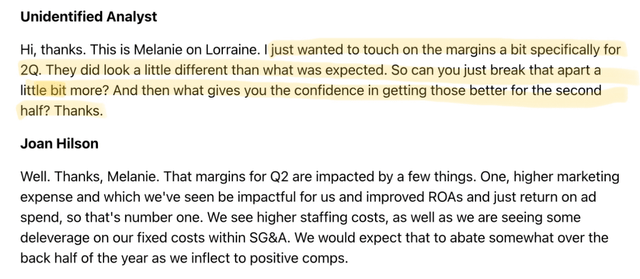
This implies a full year adjusted operating margin of 9.2%, 20bp higher than the 9% achieved last year, something that would require an extremely improved second half as the first 6 months are already expected to be 211bp lower. And this discrepancy was the theme of the first question in the last earning call.
1Q Fiscal Year 2025 Signet earning call transcript
That answer did not seem convincing enough to me for the level of improvement required in the second half, so let’s try to see, based on the company’s seasonality and from an historical perspective how realistic is that second half outlook.
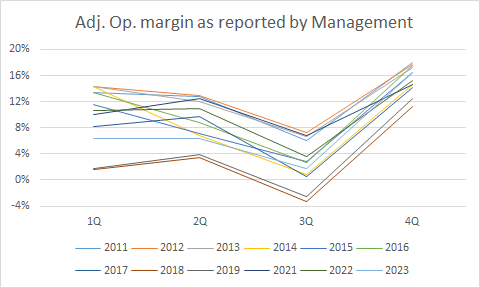
SIG financial disclosures (presented on a calendar year basis instead of fiscal year basis)
As you can, the pattern of seasonality (I left out 2020 for obvious reasons) is very stable, and there are a few observations that we can make:
- Second quarter margins are usually better than the one for the first quarter.
- Third quarter margin is always the lowest one of the year.
- Fourth quarter margin is always the highest of the year.
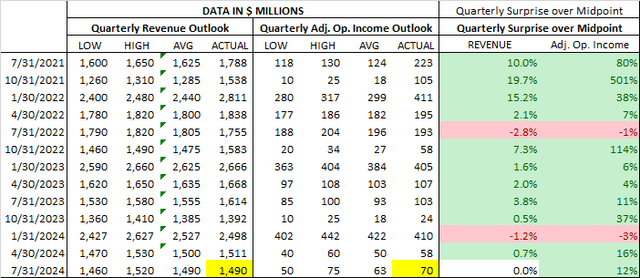
Lately the company has been able to overdeliver in terms of Adjusted Operating Income and to a lower extent in term of revenues, but those surprises have become smaller as we got away from the post pandemic consumption boom years. So, I would assume zero surprise for the 2nd quarter in terms of revenues and a mild positive one in terms of adjusted operating income (The figures marked in yellow in the next table).
SIG financial disclosures & author assumptions (presented on a calendar year basis instead of fiscal year basis)
Based on those assumptions, the second half of the year should deliver at least $3.839 million and $505 million respectively in revenues and adjusted operating Income to accomplish the guided results.
I would divide those amounts between the 3rd and 4th quarters based on historical seasonality, to show in the following tables, what are the implications for the full year distribution of both figures along the quarters and between the 1st and 2nd half of the year.
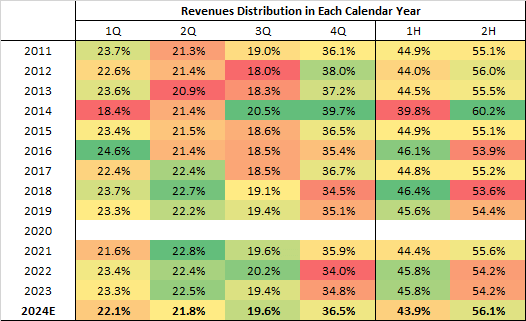
SIG financial disclosures & author assumptions (presented on a calendar year basis instead of fiscal year basis)
In terms of revenues, management’s outlook would imply a very solid second half when compared to the first, but while better than the average second half, it’s within the ranges of what has occurred in the past, so it seems challenging but doable.
But when we repeat the same exercise for the outlook given for adjusted operating income, the situation is different.
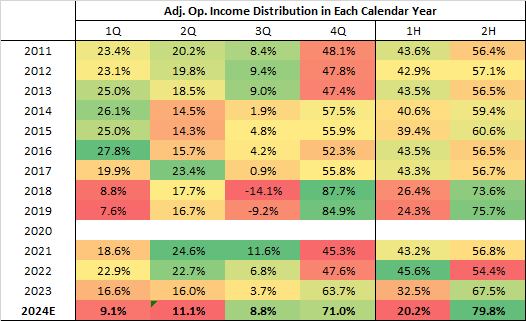
SIG financial disclosures & author assumptions (presented on a calendar year basis instead of fiscal year basis)
Here we can see that when compared with first half of the year, current FY guidance would require the best relative second half in 14 years. And in terms of margins, it would look like this.
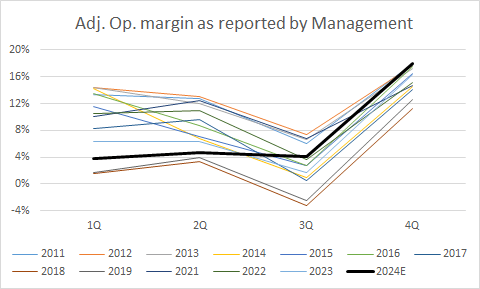
SIG financial disclosures & author assumptions (presented on a calendar year basis instead of fiscal year basis)
This outlook would require a 14-year record 4th quarter in terms of margins and a better 3rd quarter margin than the average for the first half of the year, something that has never happened in the period under analysis.
It is true that this analysis has been based exclusively on the historical seasonality of the business but is important to understand that such a stable and recurring pattern does not come out of nowhere but is the result of the underlying fundamental drivers of demand.
In the end what I am trying to highlight here is that on the face of the second quarter outlook, the implied second half of the year seems highly improbable, but not impossible. The best example of that is the year that I intentionally left out of the analysis, a year when both situations that I characterize as very unlikely to occur this year, happened at the same time. All of us know what took place in 2020, in very clinical language let’s say that there was a very significant disruption of the normal patterns of demand in the form of lockdowns and fiscal stimulus.
So, at this point we should try to think if there was anything that might have negatively affected the first half and/or on the contrary might positively affect the second half. And importantly those effects should be significant enough to take seasonal patterns away from its historical ranges.
Plausible Explanations
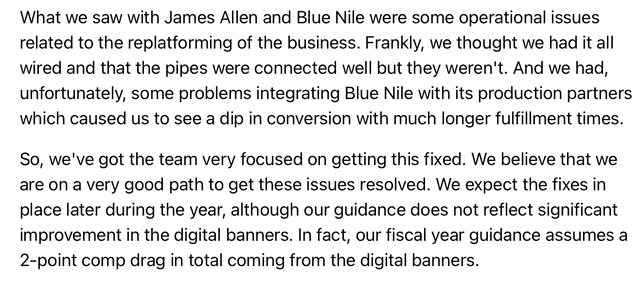
Since the 4th quarter of 2023 (4Q Fiscal Year 2024) the company has been experiencing integration problems in their digital banners that have in their words “affected conversion”. The next two screenshots come from their 4Q Fiscal Year 2024 earnings call and the third one from the one of 1Q Fiscal Year 2025.
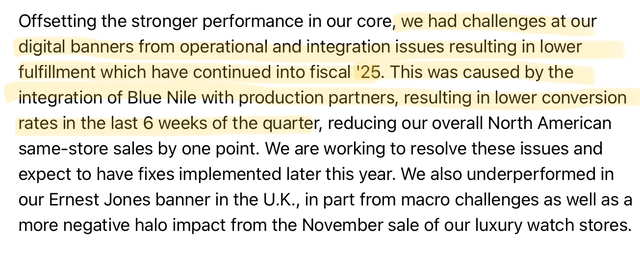
4Q Fiscal Year 2024 Signet earnings call transcript
4Q Fiscal Year 2024 Signet earnings call transcript

1Q Fiscal Year 2025 Signet earnings call transcript
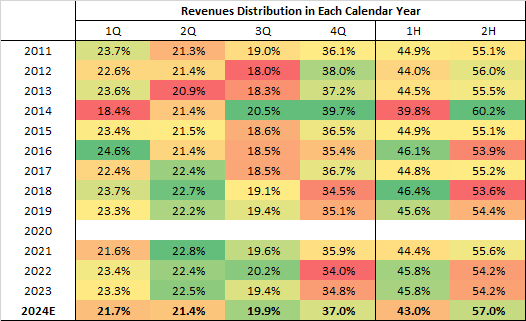
So even though management said that their outlook does not include any recovery on their digital banners, let’s assume that is this is their ace up their sleeve, and they manage to fully recover their digital banners performance for the second half improving their implied 2H revenue by the two percentage points that are mentioned in the second screenshot relating to this issue.
That would not change at all the very unlikely distribution of adjusted operation income between quarters and would make revenue distribution even more second half weighted:
SIG financial disclosures & author assumptions (presented on a calendar year basis instead of fiscal year basis)
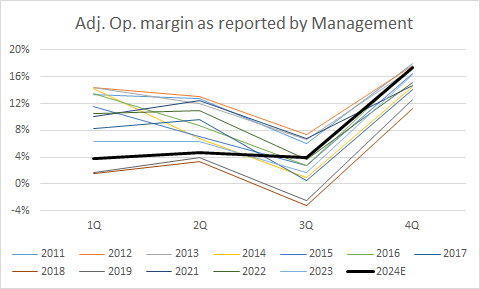
But at the same time would somewhat normalize calendar year adjusted operating margin seasonality, making it a little less improbable:
SIG financial disclosures & author assumptions (presented on a calendar year basis instead of fiscal year basis)
My perspective is that those issued are not significant enough to explain the unusual pattern of seasonality in operating income, because to be so, the integration problems should have impacted not just revenues but costs, and to a material degree, as that would have at least partially explained the poor first half margins and would give credence to a material improvement when the problem gets fixed as there is no longer the need for those extra one-time costs.
Can I be 100% sure that that did not happen, of course not, but that is the kind of issue that management teams usually highlight, as is much better for the stock to have a non-recurring explanation for a poor margin performance, than having the analyst community question whether there is a more fundamental problem that explains it. And there was not a peep about it in their call.
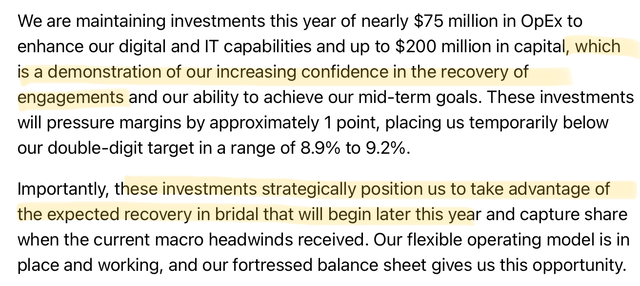
Apart from that, in terms of consumer demand, I don’t see any material change in what could be described as an overall weak US consumer, and while it’s true that management is expecting a recovery in the bridal category for the second half, they have been talking about this for more than year, so color me skeptical on that one.
Signet 1Q Fiscal Year 2024 earnings call (More than a year ago)
Another factor that needs to be considered if we are putting the hopes for such significant recovery in the second half on the back of the bridal category is demographics.
The US Census Bureau tracks the median age of the first marriage in the US. According to their latest release, that statistic stands at 30.1 years for men and 28.2 years for women.
With that in mind, we can use the demographic historical statistics and projections by country provided by the OECD. These data sets are disaggregated in age brackets of 5 years each, so we are going to focus on the 25 to 29 and 30 to 34 age brackets to try to get a good indication of the TAM for the bridal category in the United States.
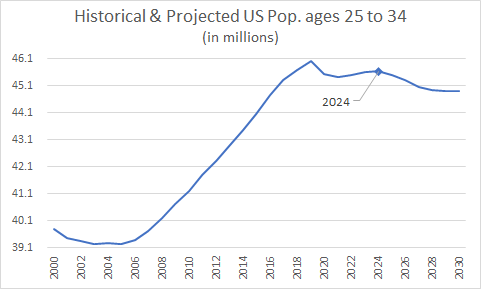
OECD
As you can see, the age bracket more likely to get married is expected to start slowly decreasing starting in 2024. And apart from that, it’s important to note that even with the underperformance of the bridal category in recent quarters, TTM revenue distribution seems to stand squarely in the middle of its historical range for this particular category.
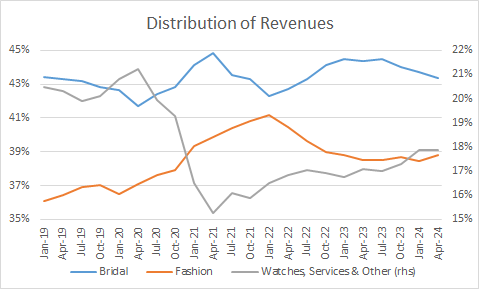
Signet financial disclosures
Another Case of a Management Team Providing a Very Lopsided FY Outlook And its Outcome
The risk that I have tried to flesh out reminds me of what recently happened with Fox Factory (FOXF), a company that I’ve been covering in recent months.
It’s absolutely true that FOXF is in a very different sector, but it’s also consumer facing and affected by the same themes (low consumer confidence, high interest rates, past years accumulated inflation, etc.) that have translated into the current weak environment of US consumption.
But more crucial than the differences and similarities between their respective industries, what I want to highlight are the similarities in the structure of their respective FY guidance in the face of weak Q1 results and poor expectations for Q2.
FOXF, reported a weak 1Q24 with a significant hit to their operating margins and at the same time guided for another weak second quarter with implied expectations of another material hit to margins. And, in so many words, this is exactly what happened with SIG in their latest earning release.
And like SIG, despite this two negative datapoints, FOXF’s management stubbornly choose to provide only very mildly reduced FY guidance that almost did not touch their expected implied operating margins. Another clear similarity, but regretfully I have to say that SIG’s case is even a worse, because they choose to fully reaffirm FY guidance in the face of a weak reported Q1 and expected Q2.
As the reader can see, this created for FOXF a very similar pattern to the one that I described for Signet, a FY guidance that very heavily relied on a much improved second half, and one that generated a seasonal structure that had never occurred in the public history of the company.
And when came time to release 2nd quarter results, management was forced to see the unrealism of their FY guidance, being forced to cut expected FY revenues by 8% and adjusted EPS by 36% with the stock cratering in a couple of days by almost 20%.
If you want to understand this situation in further detail and compare the structure of their guidance with the one provided by SIG, I put two articles (first & second) on the name. Those describe management’s outlook in detail, disaggregating their traditional operations from the confounding effects of a recent acquisition and using the same type of charts that I used for Signet in this article.
Risks
Risks to my thesis relate with the health of the consumer and the conversion capabilities by Signet, as implied expectations for the 2nd half are for a moderated 3% YoY revenue contraction compared to the 8.6% that is expected for the first half. This could, contrary to my expectations, be achieved by the combined effects of a full resolution of the integration issues previously described in their digital banners and a strong arrival of the long-awaited recovery in the bridal category.
Conclusion
Investment is a matter of probabilities, and as such, the risk of a downgrade for the second half does not translate into a certain outcome, but I think there is sufficient evidence to say that the probabilities are on this side of the argument.
Even when management reaffirmed their guidance on the last earning call, they did it with a significant caveat.
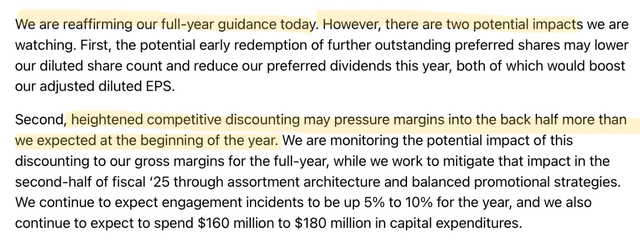
1Q Fiscal Year 2025 Signet earning call transcript
As I said at the beginning of this article, Signet has been on my watchlist as its undemanding valuation requires very conservative assumptions to underwrite an investment case, so this piece should not be understood as a repudiation of Signet as a potential mid to long term investment. On the contrary, and the case of FOXF that I used earlier is a good example of this, because as you saw in the 2nd article, the fact that I was and still am patiently bullish from a fundamental perspective, did not preclude me from selling my position before the 2nd quarter earnings release in the face of the immediate risk of a potential guidance cut.
In the end, the objective of this article is to be informative as all the data that I used for my analysis is shown in the charts, links and tables included here, and the reader can reach his or her own conclusion based on the information. Maybe some of you think that the integration issues around their digital banners are a sufficient explanation for the unusual pattern implied in their guidance, or that the bridal category can experience a sufficiently big second half turnaround, and that might end up being correct.
Apart from that, some of you might have a found a different potential driver of a much-improved second half that I missed, and if that were the case, I would welcome it in the comments section.
As always, thank you for reading, always perform your own due diligence and best of luck with your investments.

