maogg/E+ via Getty Images
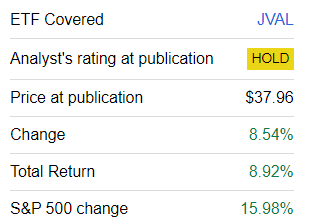
Today’s note is supposed to offer a reassessment of the JPMorgan U.S. Value Factor ETF (NYSEARCA:JVAL), a passively managed investment vehicle targeting inexpensive U.S. equities. My previous note on the ETF was presented in January of this year and had a mostly neutral tone. While expressing appreciation for the quality and value characteristics of JVAL’s portfolio, I explained that its growth-light approach translates into a risk of the fund lagging growthier plays in 2024 as investors started to prepare for the streak of interest rate cuts. And since the article was published, the ETF has significantly underperformed the S&P 500, which, as it is worth reminding, has a substantial tilt toward generously priced long-duration equities that have been shining this year.
Alas, while underperformance is sometimes a good thing as it can be used as a premise for a bullish thesis (that is to say, when a portfolio might have become more attractively priced), I am not confident that JVAL has potential in the current environment, with the reason being the same: an inadequate dosage of the growth factor. Now let us discuss all these in greater depth.
JVAL strategy recap
According to its website, JVAL’s strategy is based on the JP Morgan US Value Factor Index. The underlying index itself is essentially a fragment of the Russell 1000, calibrated using the following metrics that are enumerated in the summary prospectus: “book yield, earnings yield, dividend yield and cash flow yield.” In the fact sheet, it is clarified that the index “utilizes a rules-based approach that matches Russell 1000 sector weights.”
However, an important nuance here is that even though it is said that “holdings in the Underlying Index are selected primarily from the constituents of the Russell 1000 Index,” I have still found one name that is not in the portfolio of the iShares Russell 1000 ETF (IWB), namely Corebridge Financial (CRBG), which had a 17 bps weight in JVAL as of June 21.
Since its inception in November 2017, JVAL has accumulated AUM of $815.3 million. The expense ratio is competitive at 0.12%.
JVAL performance discussion
This year, JVAL has been participating in the rally, which I surmise has been driven mainly by the sector neutrality principle its underlying index adheres to (as a consequence, it has a tilt toward tech). However, it has still lagged the S&P 500 since my January article.

Seeking Alpha
Why has JVAL underperformed the S&P 500? As only about 2.3% of its portfolio has been replaced since January, it is much easier for us to identify contributors to and detractors from its performance than in the case of deeper recalibration.
So which stocks have detracted most? Comparing share prices as of January 2 and June 24, I have found out that the GICS communication, health care, real estate, and utilities sectors delivered the weakest results. The figures below are the average price returns for each, prepared using data from Seeking Alpha and JVAL:
| Sector | Weight (as of January 2) | Average price decline |
| Utilities | 2.5% | -1.5% |
| Real Estate | 2.8% | -2.6% |
| Health Care | 12.2% | -3.4% |
| Communication | 7.4% | -4.2% |
At the same time, what names have contributed to JVAL’s return since January? It was mainly IT that allowed it to participate in the rally this year.
| Sector | Weight (as of January 2) | Average price return |
| Energy | 3.9% | 10.4% |
| Information Technology | 26.3% | 8.7% |
| Industrials | 12.2% | 6.3% |
The most successful IT story was AppLovin Corporation (APP) which has seen its price soar by more than 99% over the period concerned. So my hypothesis here is that if JVAL followed a weighting schema more common for value strategies (i.e., without a sector-neutrality principle), its basket would likely be heavier in financials and much lighter in IT, so its YTD returns would have been even less appealing.
Other sectors that have seen solid gains are energy and industrials. The former contributed to JVAL’s return only marginally, as its weight in the portfolio was just 3.9% in January (3.4% as of June 21).
Looking at long-term performance, JVAL is still offering an annualized total return that is much more compelling than that of the iShares Russell 1000 Value ETF (IWD). However, it remains substantially behind the iShares Core S&P 500 ETF (IVV) and IWB.
| Metric | IVV | JVAL | IWD | IWB |
| Start Balance | $10,000 | $10,000 | $10,000 | $10,000 |
| End Balance | $22,263 | $19,035 | $16,660 | $21,728 |
| CAGR | 13.10% | 10.41% | 8.17% | 12.68% |
| Standard Deviation | 17.60% | 19.65% | 17.76% | 17.88% |
| Best Year | 31.25% | 31.30% | 26.13% | 31.06% |
| Worst Year | -18.16% | -11.59% | -8.42% | -19.19% |
| Maximum Drawdown | -23.93% | -29.33% | -26.73% | -24.57% |
| Sharpe Ratio | 0.67 | 0.5 | 0.41 | 0.64 |
| Sortino Ratio | 1.03 | 0.75 | 0.6 | 0.98 |
| Upside Capture | 100.55% | 95.29% | 83.9% | 100.24% |
| Downside Capture Ratio (%) | 97.08% | 101.45% | 96.37% | 98.38% |
Data from Portfolio Visualizer. The period covered is December 2017–May 2024. JVAL was incepted in November 2017
It also captured more downside than IWD, though it was significantly stronger during the market recovery periods, as is evidenced by the upside capture ratio. Here, I believe the market neutrality principle has contributed again.
JVAL factor mix: inexpensive, high-quality stocks take center stage, sufficient growth exposure is missing
As of June 21, JVAL had a portfolio of 354 domestic common stocks and REITs (350 in January). Most were present in the January version of the portfolio, as just 2.3% were replaced, as per my calculations. For instance, JVAL added GoDaddy (GDDY), Crown Holdings (CCK), and Twilio (TWLO), among others. At the same time, it removed Pioneer Natural Resources (traded with a ticker PXD, acquired by Exxon Mobil (XOM) in May), Norfolk Southern (NSC), and Entegris (ENTG), to name a few.
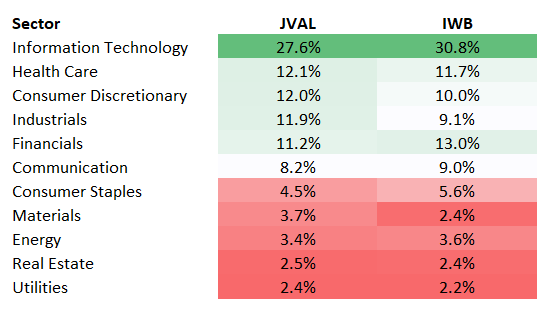
Regarding sectors, JVAL is rather close to IWB, though a few differences do exist, as shown below:

Created by the author using data from the ETFs
On the factor front, little has changed. Obviously, JVAL’s value tilt is permanent. It is evident not only from the weighted-average adjusted earnings yield of 5.7% (negative figures were removed from the calculations), which, even though it has declined from 6.4% seen in January, is still confidently ahead of the EY of the S&P 500 (3.7%). This result looks especially strong assuming its weighted-average market cap of $320.7 billion, as per my calculations, which signals that the portfolio has a significant footprint in the mega-cap echelon (34.6%, including a 9.6% allocation to the trillion-dollar league). Besides, about 27% of the holdings have a B- Quant Valuation grade or higher, which is an adequate result considering mega-cap exposure.
Importantly, JVAL is offering not only value but also sufficient quality. The first parameter I usually assess to have an understanding of a portfolio’s quality factor exposure is the share of stocks with a B- Quant Profitability grade or higher. In JVAL, it was above 89% as of June 24, which is a rather strong level. Also, we see the Return on Assets at 7.9% and the adjusted Return on Equity (negative and over-100% figures were removed) at 18.5%. Both are fairly acceptable, but I would prefer no less than 10% and 20%, respectively.
Ultimately, JVAL’s growth characteristics are rather lackluster. Obviously, they are not sufficient to outperform IVV in a scenario where the long-duration equities’ rally continues.
| EPS Fwd | Revenue Fwd |
| 5.51% | 3.65% |
Calculated by the author using data from Seeking Alpha and JVAL
Final thoughts
In sum, JVAL leverages an interesting market-neutral value strategy. Despite having a tilt toward tech as it mirrors the sector proportions of the Russell 1000, JVAL has delivered a strong earnings yield and meaningful exposure to stocks with at least a B- Quant Valuation rating or higher.
However, I am uncertain whether the style it represents has potential in the current environment, even when complemented by quality. I believe the combination that is currently the most promising is healthy growth plus robust profitability and capital efficiency. And while there is a lot of quality under the hood, there is not much growth in JVAL’s portfolio.
However, the issue here is that a few cracks in the tech rally have emerged of late as NVIDIA (NVDA) has retreated from its all-time high. In a scenario with a small correction materializing (for example, an April-like one), JVAL might offer healthier downside capture (like in 2022, for example) and perhaps even eke out some gains, but only if the tech correction is accompanied by the capital rotation. All in all, assuming JVAL’s strengths and weaknesses, the Hold rating is maintained.

