Focus on Organic Growth! Tom Werner/DigitalVision via Getty Images
Thesis
The sentiment among Seeking Alpha analysts is overwhelmingly positive on GigaCloud Technology (NASDAQ:GCT), with bullish arguments focused on the company’s seemingly strong growth:
GigaCloud Technology Seeking Alpha Narratives (Seeking Alpha)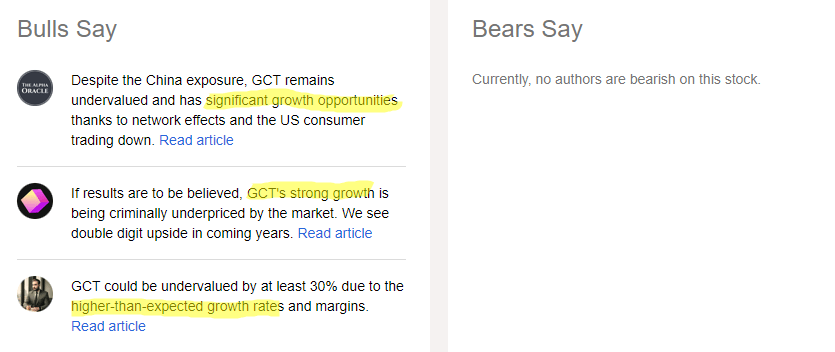
However, I am not as enthused, as I believe headline growth numbers can be a little misleading. Instead, I put my focus on assessing the organic growth profile of the business. With this lens, I have a more cautious outlook on GCT:
- I am unsatisfied with the lack of reporting on organic growth numbers
- My triangulated estimates reveal that organic growth is half that of headline figures
- Valuations seem to be near historical fair value ranges
I am unsatisfied with the lack of reporting on organic growth numbers
In the Q1 FY24 earnings call, CEO Lei Wu claimed that despite macro weakness in retail furniture sales, the company was able to grow at nearly 100% YoY:
…we’re pleased to share GigaCloud’s strongest ever first quarter results and our fifth consecutive quarter of revenue growth. This comes even as consumer spending softens. For instance, the US Consensus Bureau reported an almost 8% year-over-year decline in retail furniture sales of Q1 2024. Despite these headwinds, GigaCloud achieved the top line results that nearly doubled the year-over-year…
– CEO Lei Wu in the Q1 FY24 earnings call
However, I don’t believe this is a fair growth comparison because GigaCloud’s revenues since Q4 FY23 have been boosted by its acquisition of home furnishings’ distributor Noble House Furnishings for $85 million. I posit that it would not be a like-for-like comparison to benchmark sectoral growth performance with a revenue figure that includes acquired revenues.
Other analysts seem to think the same way as the first question in the Q1 FY24 earnings call was on the split of organic and inorganic revenues. Disappointingly, CFO Kwok Lau declined to provide this key detail to the investor community:
So as we discussed in our last call, we don’t break it out between what’s organic and what’s inorganic because right now we’re kind of in the middle of fully integrating the business.
– CFO Kwok Lau in the Q1 FY24 earnings call
Thus, from an overall transparency standpoint, GCT’s management loses some points in my book.
My triangulated estimates reveal that organic growth is half that of headline figures
Although management has not provided explicit data, some detective work can be done in 2 different ways to estimate the revenue contribution of Noble House:
Using warehouse capacity as a proxy
According to the company’s FY23 10-K, GCT has a total of 8.2 million square feet in warehouse space. In the same document, Noble House’s warehouse capacity is disclosed to be 2.5 million square feet in total:
The acquisition of Noble House added six warehouses with approximately 2.4 million square feet of warehouse space to our warehousing network in the U.S., and one warehouse with approximately 0.1 million square feet of warehouse space in Canada.
– Business Overview section in the FY23 10-K
2.5 million is about 30% of 8.2 million. Hence, assuming revenues are directly proportional to warehouse capacity (a crude but reasonable long term assumption in my view), this means Noble House contributes 30% of overall revenues since Q4 FY23.
Using off-platform revenues as a proxy
In the Q1 FY24 earnings call, the CFO gave us a clue that incremental off-platform e-commerce revenue was driven mostly by Noble House.
but you’re correct pointing out that the off-platform e-com revenue generation is driven mostly by the normal [Noble] house business.
– CFO Kwok Lau in the Q1 FY24 earnings call
The YoY incremental off-platform revenue as of Q1 FY24 is $62 million, based on the latest 10-Q filings:
GCT Off-Platform Revenue YoY (Company Filings, Author’s Analysis)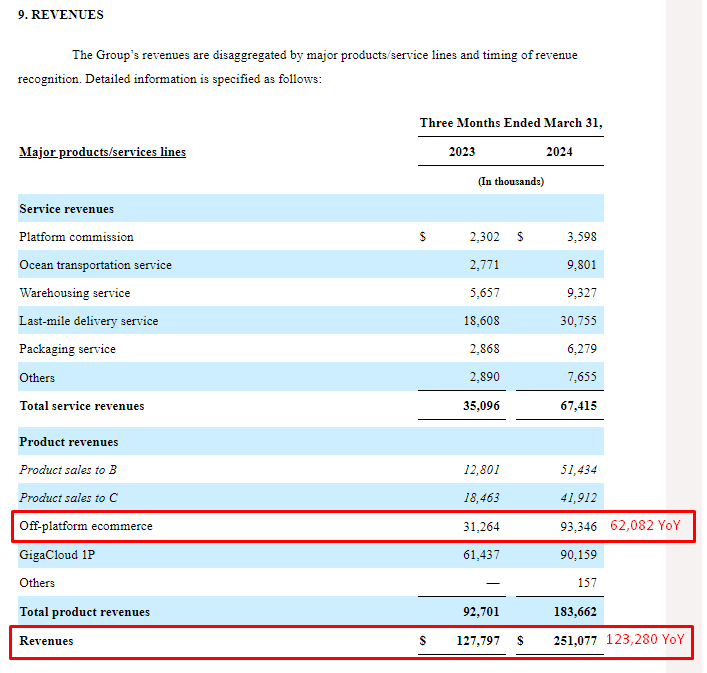
The overall YoY increment in revenues for Q1 FY24 is $123 million.
Now, I’m going to assume that all of the YoY off-platform revenues, is attributable to Noble House. I believe this is a sensible and conservative assumption; note that GCT’s organic off-platform revenues showed a 7.7% degrowth in FY22.
This means that Noble House contributed a 62/123 = ~50% of overall revenues.
Giving management the benefit of the doubt
So one estimate says Noble House makes up 30% of overall revenues. Another says 50%. To give management the benefit of the doubt by not undermining the organic revenues estimates too much, I will assume the inorganic portion to be 30% of overall revenues in Q4 FY23 and Q1 FY24. Given this assumption, this is what the organic growth profile looks like compared to headline growth:
Organic Growth Dissection (Company Filings, Author’s Analysis)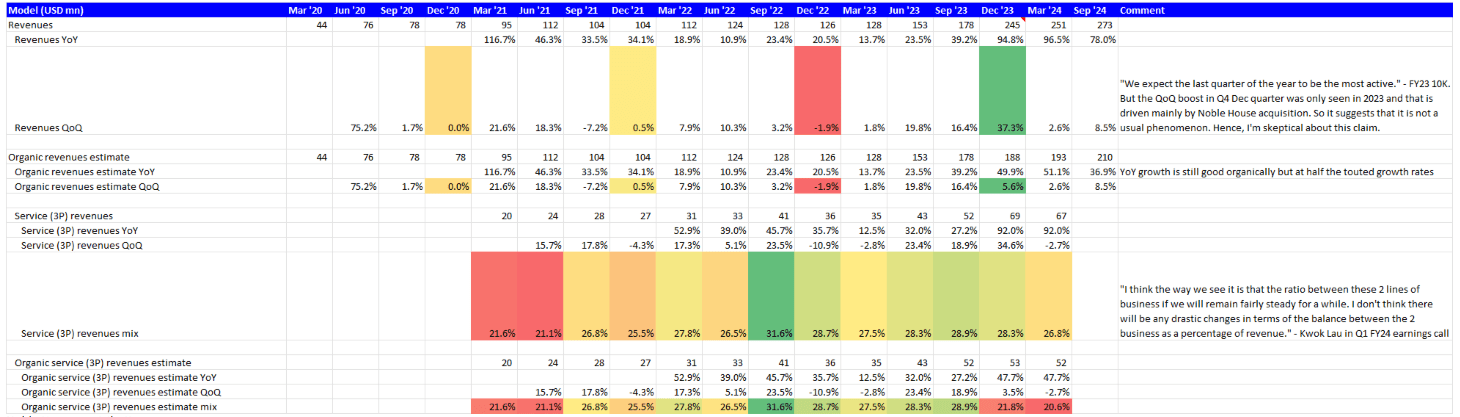
Instead of $245 and $251 million headline revenues for Q4 FY23 and Q1 FY24, my organic revenues estimate show $188 and $193 million respectively. This leads to YoY growth rates of close to 50% rather than close to 100%; still strong but at half the overall headline growth figures.
Assuming the same 30% inorganic contribution, Q2 FY24 is expected to yield a 37% YoY growth rather than the 78% YoY growth at an overall level.
I would like to stress my point that organic growth is what investors ought to focus on since purchased or acquired revenues is not reflective of true operational performance.
Also note that management commented that Q4 tends to be the most active. However, looking at the broader time-series of numbers, the QoQ growth in the 4th quarters of 2020, 2021 and 2022 have been negligible at 0.0%, 0.5% and -1.9% respectively. Only in 2023 is the organic QoQ growth a bit higher at 5.6%. But this is nothing compared to mid-to-high teens QoQ growth in Q2 FY23 and Q3 FY23. Hence, I am a bit puzzled by management’s expectation that Q4 tends to be the most active season since the numbers do not yet support that seasonality narrative.
Finally, with these insights on the organic and inorganic growth split, I draw your attention to the following active buyer spend cohort chart disclosed in page 10 of the company’s Q1 FY24 investor presentation:
Active Buyer Spend Cohort Chart (Company Filings, Author’s Highlights)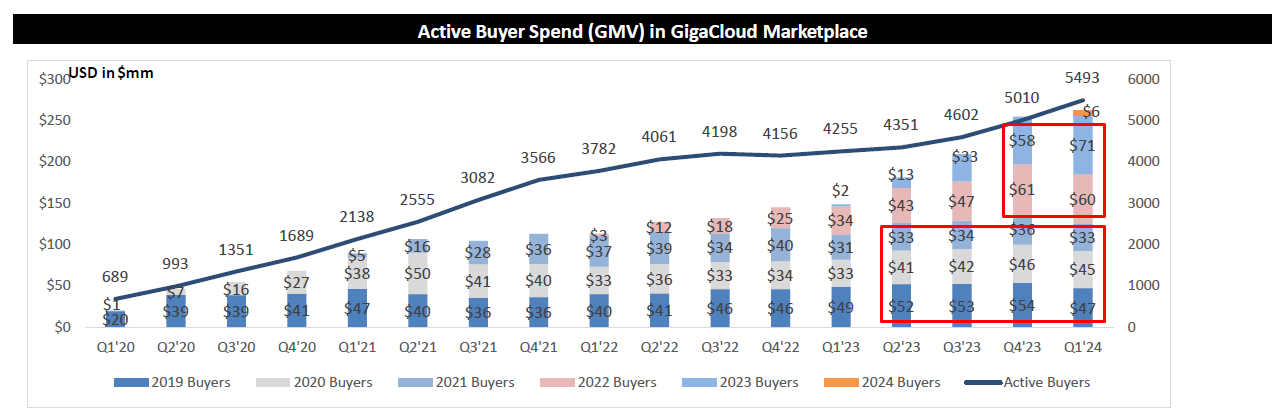
Without organic growth context, the active buyer spend acceleration by 2022 and 2023 buyers in Q4 FY23 and Q1 FY24 would seem very impressive. However, I believe this is likely boosted by the Noble House acquisition. A key question that supports this view is: “Why did the boost in spend in the last 2 quarters affect only 2022 and 2023 buyers but not 2019 to 2021 buyers?”
Overall growth profile assessment
Given the considerations above, the bottom line is that GCT is still growing well, but organically, at half the headline numbers; there is a big difference between close to 100% YoY and 50% YoY!
Valuations seem to be near historical fair value ranges
GCT 1-yr fwd EV/EBIT (Capital IQ, Author’s Analysis)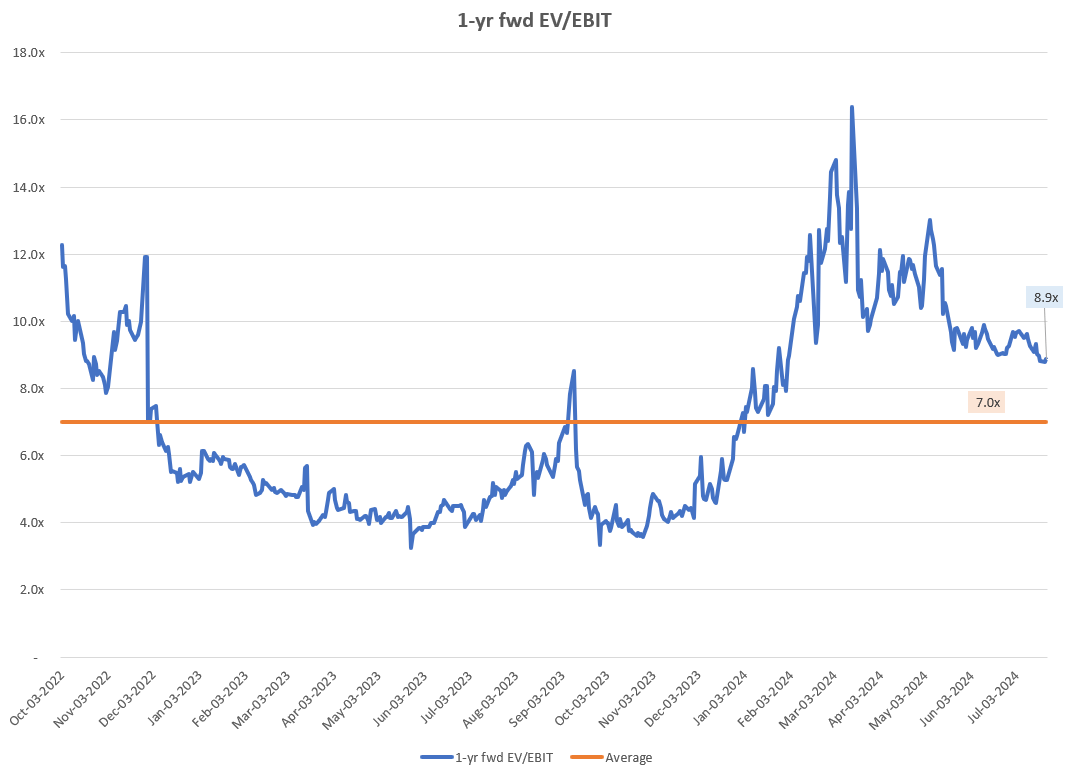
GCT is trading at a 1-yr fwd EV/EBIT of 8.9x, which corresponds to a 27% premium to the longer term average of 7.0x. I believe this is reasonable as the company is organically growing at close to 50% YoY, which is about 25% higher than the almost 40% YoY growth seen in the September 2023 quarter, when the 1-yr fwd EV/EBIT was close to the long term average multiple of 7.0x. Hence, a 27% premium for a 25% higher growth track seems appropriate, indicating fair value. Note that if the 2x higher growth numbers were considered, the stock would appear undervalued.
Technical Analysis
If this is your first time reading a Hunting Alpha article using Technical Analysis, you may want to read this post, which explains how and why I read the charts the way I do. All my charts reflect total shareholder return as they are adjusted for dividends/distributions.
Relative Read of GCT vs SPX500
GCT vs SPX500 Technical Analysis (TradingView, Author’s Analysis)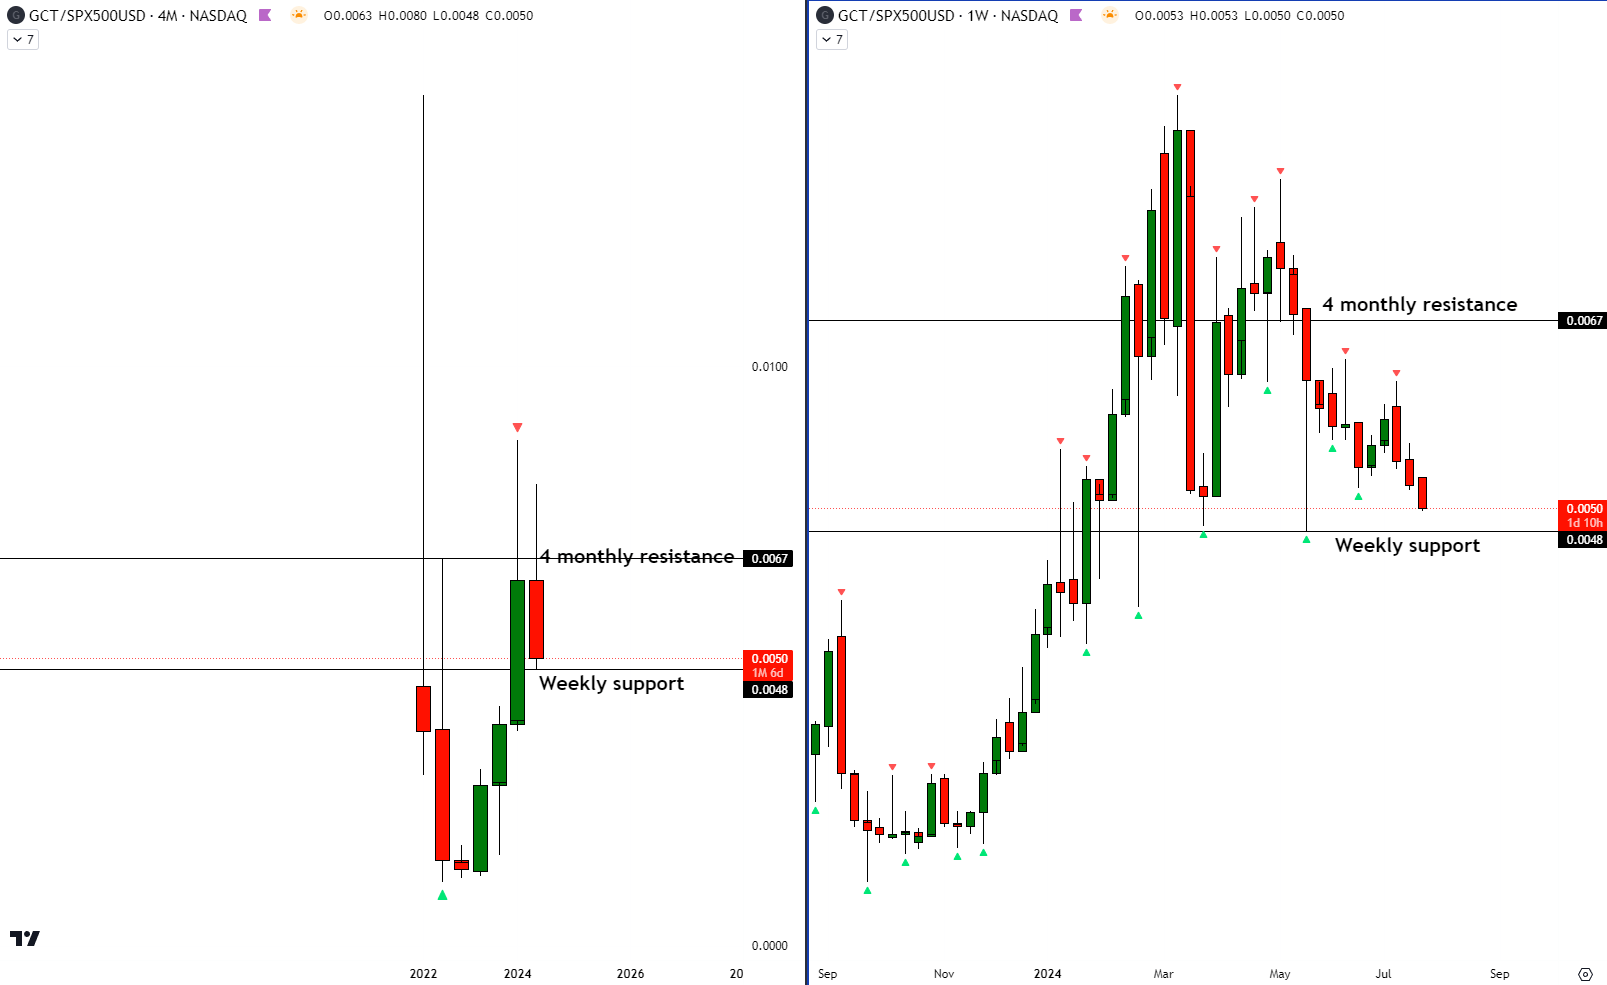
From a relative technical analysis perspective of GCT vs the S&P500, I note that the ratio prices are bouncing in between a 4-monthly resistance level and a weekly support. This makes me lean slightly bearish due to the proximity to higher timeframe resistance. However, in the absence of a breakout to the downside or any leading signs of such (via a false break to the upside for example), I maintain a neutral view on the stock.
Key Monitorables
In the Q1 FY24 earnings call, the CFO Kwok Lau noted that there is an outdoor furniture season in Q2. This is a positive catalyst I am watching. However, there is a counterbalancing effect too, since the durable goods orders growth has been tepid in recent months with close to 0% MoM growth:
United States Durable Goods Orders MoM % (Trading Economics)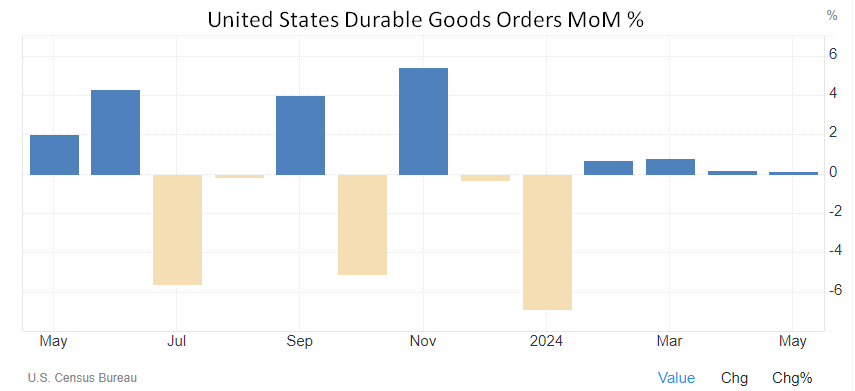
I believe this is a relevant leading macro indicator for GCT since GigaCloud’s e-commerce marketplace is focused on furniture durable goods, which comprises more than 90% of revenues. Also, the United States makes up the bulk (76%) of overall revenues as of Q1 FY24.
Takeaway & Positioning
GigaCloud Technology’s bulls seem to be enamored by the company’s strong headline growth. However, I believe headline growth numbers are not the right metric to focus on as those numbers are skewed by the impacts of a major recent acquisition. Instead, I am interested in the organic growth profile of the business.
Unfortunately, company management has declined to provide the organic revenue detail despite being asked for that key information by analysts in the Q1 FY24 earnings call. In my view, this does not score well in terms of reporting transparency.
Nevertheless, I believe I have arrived at reasonable estimates of the organic vs inorganic revenue split by triangulating data based on a few clues provided in the filings. The key finding that arises from this is that GCT is growing at half the headline growth rates; 50% YoY instead of close to 100% YoY. Whilst this is still strong, it is a major difference which swings my valuation assessment from undervalued to fairly valued.
Hence, I rate the stock a ‘Neutral/Hold’.
How to interpret Hunting Alpha’s ratings:
Strong Buy: Expect the company to outperform the S&P500 on a total shareholder return basis, with higher than usual confidence
Buy: Expect the company to outperform the S&P500 on a total shareholder return basis
Neutral/hold: Expect the company to perform in-line with the S&P500 on a total shareholder return basis
Sell: Expect the company to underperform the S&P500 on a total shareholder return basis
Strong Sell: Expect the company to underperform the S&P500 on a total shareholder return basis, with higher than usual confidence
The typical time-horizon for my views is multiple quarters to around a year. It is not set in stone. However, I will share updates on my changes in stance in a pinned comment to this article and may also publish a new article discussing the reasons for the change in view.

