ZargonDesign/iStock via Getty Images
What picture do I think represents the state of monetary policy right now?
I think that this chart tells the story pretty well.
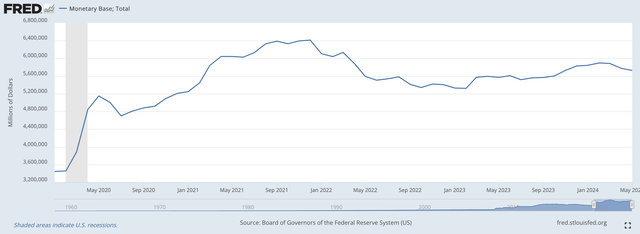
Monetary Base (Federal Reserve)
From February 2020 through May 2024, the monetary base, the foundation of the country’s money stock has risen by 65.7 percent!
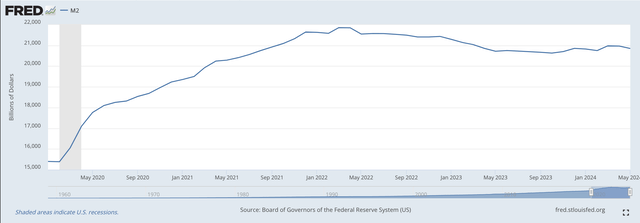
The M2 money stock has followed a somewhat similar path.
M2 Money Stock (Federal Reserve)
The “bulge” in the money stock was connected with some inflation.
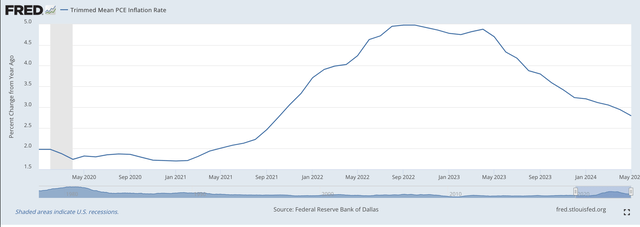
Mean PCE Inflation Rate (Federal Reserve)
Here the year-over-year mean PCE inflation rate topped out around 5.0 percent in late 2022 and has been dropping ever since.
The last figure on the chart shows a year-over-year inflation rate of 2.8 percent.
The goal is 2.0 percent.
The numbers are certainly moving in the right direction.
The basic point is that the “bulge” in monetary growth came earlier in the 2020s, and it was quite some bulge.
In a little over four years, from February 2020 until May 2024, the M2 money stock rose by just around 36.0 percent, an average of 9.0 percent per year.
One could say consumer price inflation had to take place.
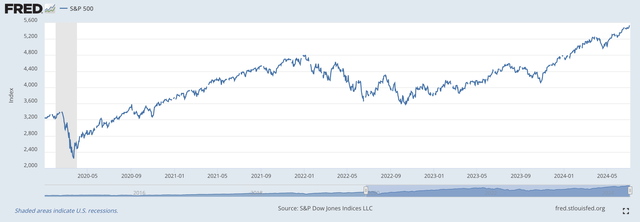
In terms of other price inflation, the S&P 500 stock index rose by about 150.0 percent over this time period.
S&P 500 Stock Index (Federal Reserve)
Federal Reserve Future
Given that the economy is moving along relatively smoothly, the best Federal Reserve goal might be for the M2 money stock to stay around where it is for another two- to four years.
That would bring the average annual rate of growth down to somewhere between 4.5 percent and 6.0 percent.
The question is, how does the Federal Reserve get down to these numbers?
Well, quantitative tightening has seemed to work so far.
Round one of quantitative tightening began in March 2022.
Looking at the first chart, it appears as if the monetary base hit its peak in the February/March period of 2022.
After dropping for about one year, the monetary base leveled off for the last nine months of 2023 and one into 2024.
The M2 money stock seems to have topped out around March/April 2022 and then leveled off somewhere around the level it now holds.
The price inflation numbers seem to have peaked in the fall of 2022 and have been falling ever since.
The crucial variable here is the price inflation number. The Federal Reserve would like this number to decline from its current rate of a year-over-year 2.8 percent to somewhere around a year-over-year rate of about 2.0 percent.
It seems as if the Fed is on the right track.
The Federal Reserve has been engaged in the first round of quantitative tightening since March 2022.
In May, it indicated that it might slow down the rate of its quantitative tightening in June.
Right now, I feel that it is a little too early to tell whether or not the Fed has actually slowed down the pace it was reducing its securities portfolio, but entering a second round of quantitative tightening, a round in which the Fed lowered the rate at which it was reducing its securities portfolio…would not be a “bad thing”.
The financial markets seem relatively stable right now.
The last thing the Fed needs to do is to make a major quantitative change in policy
The Fed is now in its 28th month of its first round of quantitative tightening.
The Fed, I believe, has succeeded in coming this far because it has provided “forward guidance” about its monetary stance, and it has persisted in the current “stance” for over two years.
Market participants have built up a great deal of “trust” in the Fed over this particular period of time. There have not been any “surprises”!
The Fed would like to move onto “round two” of quantitative tightening, maintaining the “trust” that it has built up in the market.
But, the Fed needs to make a change to keep things moving smoothly.
And, the Fed doesn’t need to start increasing the size of its securities portfolio at this time.
The banking system still has plenty of “cash” in its vaults…over $3.3 trillion…and this, I believe, Federal Reserve officials think is excessive.
So, there is still reason to keep up the quantitative tightening to lower these “pools of cash” but the Fed needs to do everything it can to continue the “reduction” in a smooth, persistent way.
One Additional Point
The “trust” that the Federal Reserve has “earned” has contributed to the positive attitude investors have maintained in the stock market.
As can be seen in the chart on the S&P stock index, the stock market has performed very well during the past four years.
In the past week, the S&P 500 stock index hit three new “historic highs” while the NASDAQ hit four new “historic highs”.
NOT TOO BAD!
The Federal Reserve would like for market participants to keep up this attitude.
Of course, there are “happenings” going on that could “shake up” things and produce another way the market thinks. One thing, the state of the current presidential election, I have just written about.
The Fed has built up a substantial amount of trust in the market…and, they really do not want to lose it.
Bottom Line
The bottom line still is that the Federal Reserve still has a way to go to get things back to a “more normal” condition, one that is a little more like the decade of the 2010s.
In terms of the Federal Reserve balance sheet (Federal Reserve release H.4.1), the Federal Reserve oversaw a $15.7 billion reduction in its securities portfolio in the last banking week.
The reduction over the past five weeks has been right at $70.0 billion.
For the whole period of quantitative tightening, the reduction has been right at $1,714.3 billion, or, $1.7 trillion.
Offsetting this reduction on the liability side of the Fed’s balance sheet, the Fed’s use of reverse repurchase agreements has gone down by $1,053.3 billion, or, $1.1 trillion.
The excess reserves in the banking system, the line item Reserve Balances with Federal Reserve Banks, have declined by $571.2 billion, or, $0.6 trillion.
The excess reserves in the banking system now total about $3.3 trillion.
The banking system still has lots and lots of liquidity on its balance sheet.

