pcess609
Introduction
There is an emerging trend to focus on investing companies that perform well on environmental, social, and governance (ESG) criteria. Not only does ESG investing offer investors the opportunity to positively impact the environment and society, investors also believe companies that are better prioritized towards ESG are likely to be less risky, more resilient to uncertainties, and better positioned for the long term. However, will it really introduce better investment returns in the long run? Or will it actually result in lower returns? We will analyze Vanguard ESG U.S. Stock ETF (BATS:ESGV) and provide our insights.
ETF Overview
ESGV has a portfolio of U.S. stocks that are screened for certain ESG criteria. The fund’s expense ratio of 0.09% is quite low. This expense ratio is comparable to other broader market ETFs such as SPDR S&P 500 ETF (SPY), which charges also 0.09%. The fund exhibits similar performance to the S&P 500 index since its inception in 2018. Its inclusion of small-cap stocks makes it slightly more volatile than the S&P 500 index. ESGV has a slightly higher growth profile than the S&P 500 index. This may eventually result in higher returns than the S&P 500 index in the long run. Hence, investors may want to consider adding this fund, especially if they want to diversify their portfolio.
YCharts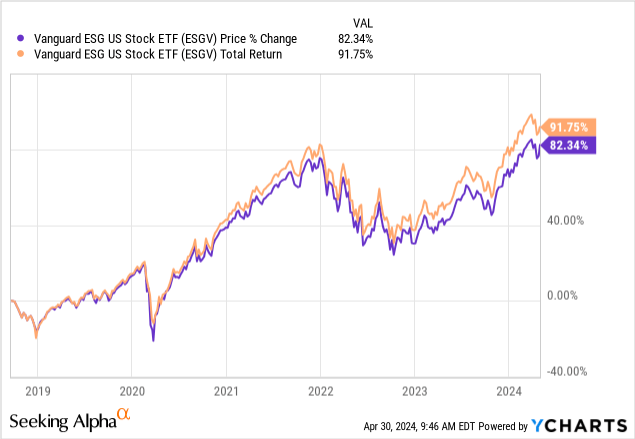
Fund Analysis
ESGV has done well since the low reached in October 2022
Like most other broader market ETFs, ESGV has done well since the cyclical low reached in October 2022. In fact, the fund has delivered a price return and total return of 41.1% and 46.1%, respectively. This is generally in line with the S&P 500 index, which registered a price return and total return of 40.6% and 46.6%, respectively.
YCharts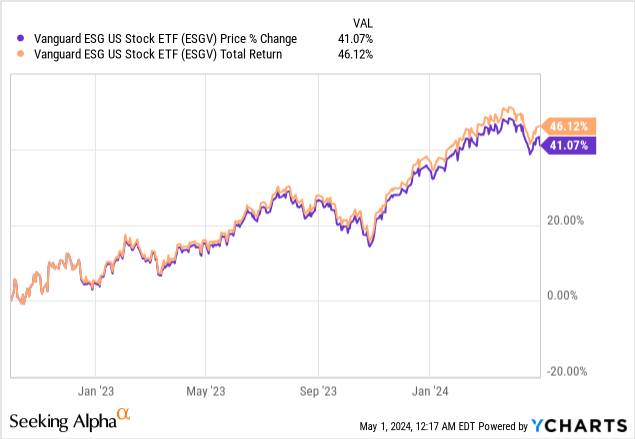
ESGV has comparable returns to the S&P 500 index
Below is a chart that shows how ESGV has performed since its inception in 2018. As can be seen from the chart below, the fund delivered price return and total return of 76.3% and 91.8%, respectively. This return is generally in line with the S&P 500 index. In fact, the fund’s price return of 76.3% was slightly better than the S&P 500 index’s 72.7%, but its total return of 91.8% slightly underperformed the S&P 500 index’s 93.4%.
YCharts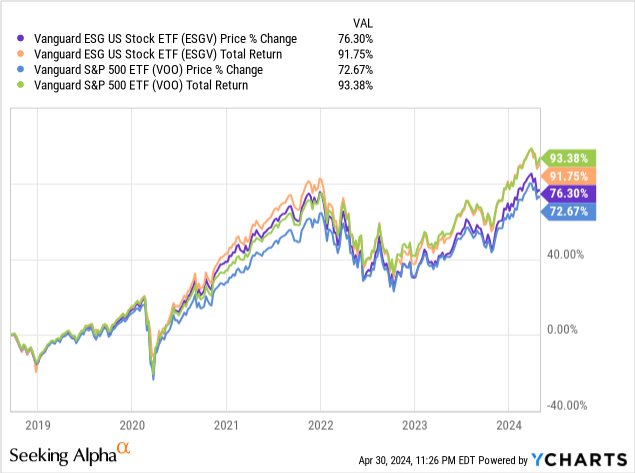
ESGV’s exposure to small-cap stocks means it will likely be more volatile
The chart below shows the stock style of ESGV. While large-cap stocks represent about 74% of its total portfolio, small-cap stocks still represent about 7% of the index. In contrast, the S&P 500 index has no exposure to small-cap stocks at all. ESGV’s exposure to small-cap stocks may not be a lot, but still can make its fund price slightly more volatile than the S&P 500 index. Think of small-cap stocks as small boats sailing through an ocean. Even a small turbulence can be quite shaky for small boats. In contrast, large-cap stocks are just like big boats that have a much better chance of weathering any storms. Fortunately, ESGV’s 7% exposure to small-cap is not a lot, but still makes it slightly volatile than the S&P 500 index. In fact, it has an average 5-year beta of about 1.05.
Morningstar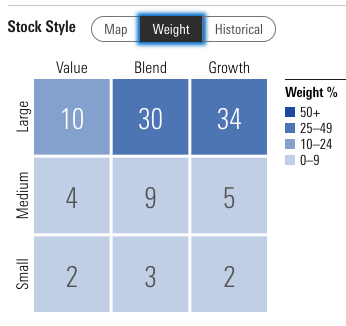
ESGV is slightly tilted towards growth than the S&P 500 index
The stock style chart we presented in the previous section also shows that growth stocks represent about 41% of ESGV’s total portfolio (34% large-cap, 5% medium cap, and 2% small-cap). This is much higher than the 16% representation of value stocks in its portfolio. In contrast, growth and value stocks represent about 37% and 22% of the S&P 500 index, respectively. Therefore, ESGV is slightly tilted towards growth than the S&P 500 index. This is consistent when we examine the consensus long-term earnings growth rate of the two. As the table below shows, the 12.5% average long-term earnings growth rate of ESGV is also slightly higher than the S&P 500 index’s 11.9%.
|
ESGV |
S&P 500 Index |
|
|
Growth Stocks Representation |
41% |
37% |
|
Value Stocks Representation |
16% |
22% |
|
Average Long-Term Earnings Growth Rate |
12.5% |
11.9% |
Source: Morningstar
ESGV is not immune to macroeconomic conditions
As we have analyzed so far, ESGV exhibits similar traits when faced with any macroeconomic conditions. Like the S&P 500 index, its fund price can decline significantly in market turmoil. As the chart below shows, ESGV declined by the same degree in 2019 and 2020 during the market downturn. It has even declined more than the S&P 500 index in 2022 when the Federal Reserve aggressively hiked the rate. Fortunately, when the economy rebounds, the fund can also perform well, and have comparable returns to the broader market.
YCharts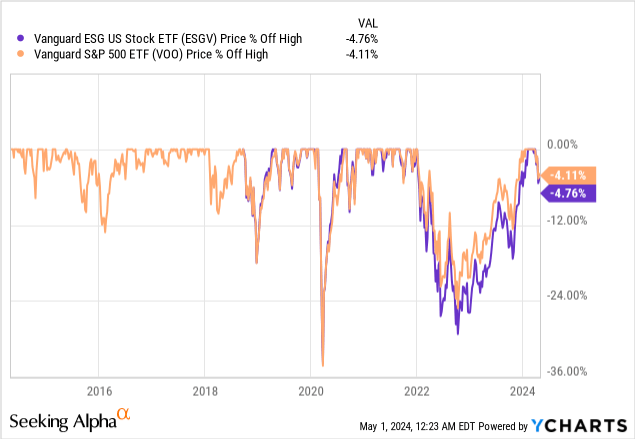
Investor Takeaway
While ESGV’s past return was comparable to the S&P 500 index, it has a slightly better growth profile. This may help it to eventually achieve higher return than the S&P 500 index in the long run. Therefore, we think it is worthwhile owning this fund, especially if investors want to add more diversity to their portfolio.

