JLGutierrez
The state of the labor market has been the subject of fierce debate.
A divergence among popular employment indicators has emerged, calling into question which indicator we should trust.
Nonfarm payrolls continue to post monthly gains, even after the downward benchmark revision, while the unemployment rate has surged almost 100bps in the last 15 months.
How do we square these seemingly conflicting messages to most accurately assess the current state of the labor market?
Building upon the work of the Business Cycle legend Geoffrey Moore, we can create a composite “Coincident” labor market index that helps to reduce some of this confusion.
As the name suggests, a “Coincident” indicator gauges the current conditions of the labor market. A “Leading” indicator sees future inflection points or changes in the Coincident Indicator.
Nonfarm Payrolls, Aggregate Weekly Hours, the Household Employment Level, the U3 Unemployment Rate, and the Insured Unemployment Rate have all been reliable indicators of the labor market for decades.
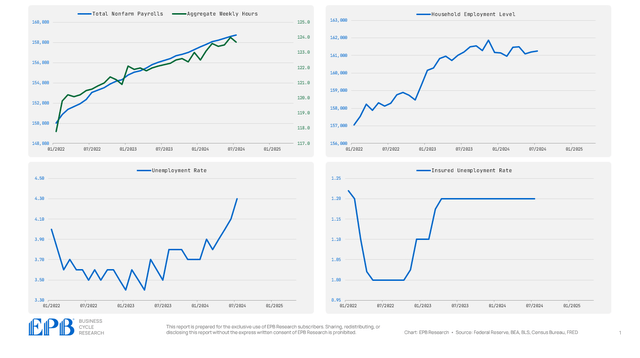
As the chart below shows, nonfarm payrolls and aggregate weekly hours continue to trend higher, while the household employment level peaked in November 2022. The unemployment rate is rising rapidly, and the insured unemployment rate is off the low point of the cycle but has held flat over the last several months.
Rather than pick which indicator is best and ignore the rest, it is far more useful to aggregate all these reliable measures into one composite index. Any single indicator is subject to failure at a turning point due to measurement errors or other idiosyncratic factors, but aggregating various metrics from different surveys and reports helps see through some of the conflicting signals.
To create this Coincident Employment Index, we first standardize each indicator for volatility and then aggregate an equal-weighted blend of these standardized metrics.
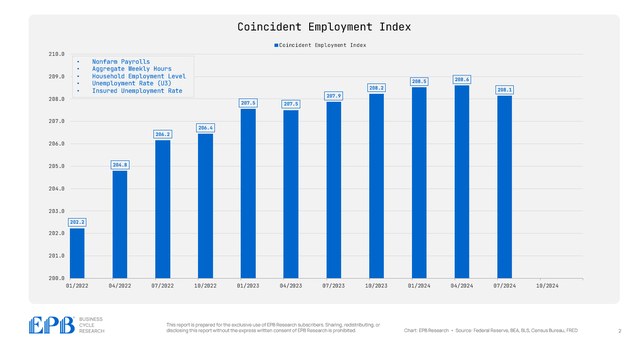
The chart below shows the quarterly average level of the EPB Coincident Employment Index. The biggest point of note is that the Coincident Employment Index has declined so far in Q3, now lower than the average reading in Q2 and Q1.
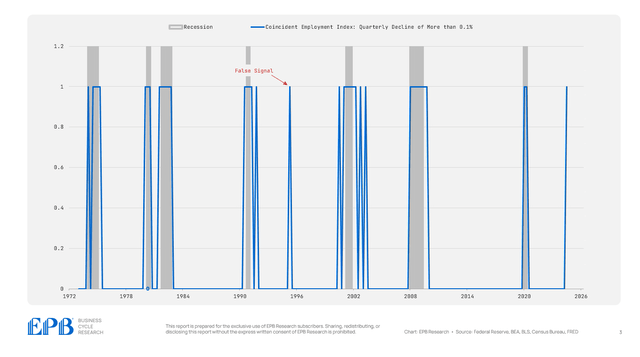
The chart below shows periods when there was a quarterly decline in the EPB Coincident Employment Index of more than 0.1%.
One false signal was registered in 1995, which was an economic downturn that required the Federal Reserve to reduce interest rates.
All other instances of quarterly declines in this 5-factor composite index occurred around or in recessionary periods.
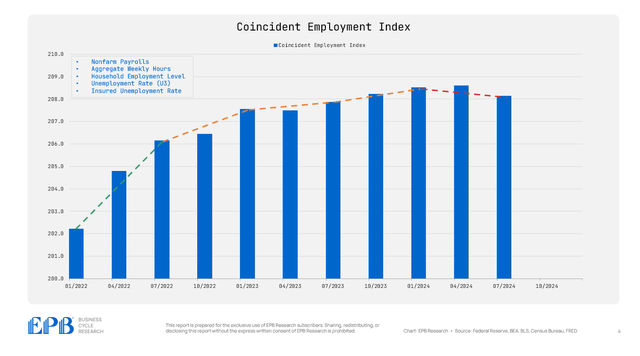
The labor market was slowing down before registering this quarterly decline in Q3, as the chart below shows the three-quarter slope since 2022.
Early in 2022, the EPB Coincident Index rose sharply as the labor market was very hot. The rate of increase started to ease throughout 2023, and now, the index has a negative slope over the last three quarters.
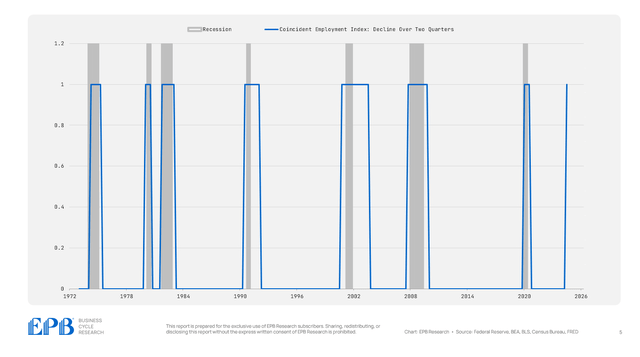
The chart below shows periods when the EPB Coincident Employment Index declined compared to two quarters ago. As the chart shows, no false signals exist dating back to 1973, and the signal overlaps closely with recessionary periods.
This signal was triggered:
-
1 quarter after the 1974 recession started
-
1 quarter before the 1980 recession started
-
0 quarters before the 1982 recession started
-
1 quarter before the 1991 recession started
-
2 quarters before the 2001 recession started
-
1 quarter before the 2008 recession started
On average, the signal was triggered 0.66 quarters before the recession start.
To reiterate, this is a Coincident measure that is not designed to be forward-looking, but rather to provide an accurate assessment of current conditions.
This composite indicator approach is enhanced by coupling the signals from the Coincident Indicators with the signals from the Leading Indicators, such as the Leading Employment Index, which we highlight regularly in our research publications.
The 5-Factor EPB Coincident Employment Index is flashing red, signaling a potential contraction in the labor market.
Right now, the readings from five reliable labor market measures are mixed, but when equalizing all factors and taking a collective reading, we see weakness, which likely requires interest rate reductions.
The Coincident Employment Index is being pulled down by the household employment level and the U3 unemployment rate, which is partially offset by nonfarm payrolls and aggregate weekly hours.
The biggest risk for the Federal Reserve and market participants is to ignore parts of the labor market basket and only focus on the variables that confirm prior views.
The EPB Coincident Employment Index is beneficial because it is a broad measure and a perfectly consistent way to track the current labor market situation on a monthly basis.
Of course, it is important to track an even wider array of data points, including critical Leading Indicators, but this one index provides a massive improvement in interpreting the labor market situation.
Our objective reading from the Coincident Employment Index is that the labor market is weakening and possibly contracting, which has a history of coinciding with economic downturns and interest rate reductions from the Federal Reserve.
We provide an updated reading of this Coincident Employment Index to clients after each Employment Situation Report.
