grandriver
On Thursday, July 25, 2024, Appalachian-focused natural gas producer CNX Resources Corporation (NYSE:CNX) announced its second-quarter 2024 earnings results. At first glance, these earnings were rather disappointing as CNX Resources missed the expectations of its analysts on both revenue and earnings:
Seeking Alpha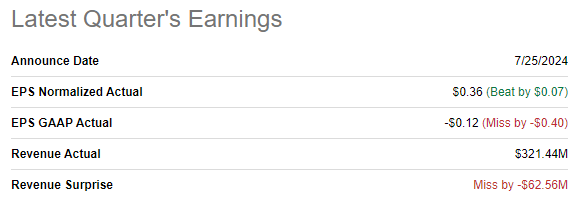
We do, however, see that the company beat expectations on a normalized basis. This is not a GAAP figure, and the headlines said that the company missed earnings expectations. The company reported a net loss in any case so the profit shown by the normalized earnings per share is rather misleading. For the second quarter, CNX Resources reported a net loss of $18.261 million which works out to $0.12 per share.
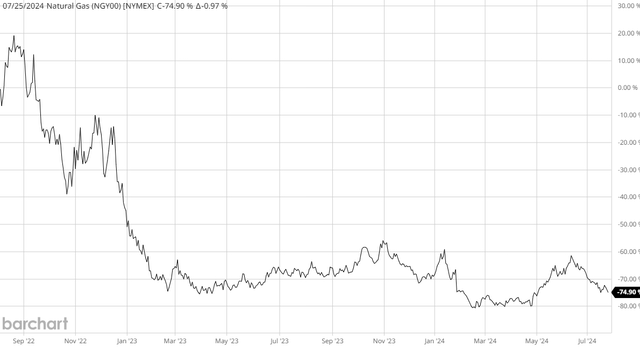
It is, admittedly, not particularly surprising that CNX Resources lost money during the second quarter of this year. CNX Resources, like all Appalachian producers, primarily earns its money by extracting natural gas from the ground and selling it. Natural gas prices in the United States have been very low for quite some time. Here is a chart showing the price of natural gas at Henry Hub over the past two years:
As we can see, the price of this compound has declined by a whopping 74.90% over the trailing 24-month period. This would naturally have a significant impact on CNX Resources’ revenues and ultimately earnings. We will discuss this in more detail over the remainder of this article.
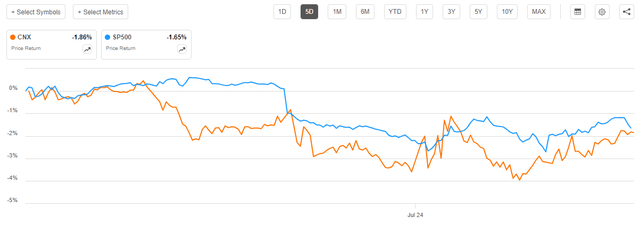
Curiously, the market was rather kind to CNX Resources’ share price surrounding the release of its second-quarter earnings. Over the past five days, the share price has only declined by 1.86%, which is not significantly worse than the 1.65% decline of the S&P 500 Index (SP500) over the same period:
This suggests that the market was expecting CNX Resources’ earnings to disappoint and thus the earnings report simply described a scenario that was already priced into the stock. Appalachian natural gas giant EQT Corporation (EQT) released its second-quarter earnings the day before, and its earnings also showed a net loss, so it might be a reasonable assumption that the market was expecting to see losses from independent natural gas producers. It is also possible that the stock’s relatively similar performance to the market simply reflects the low liquidity that the capital markets have been suffering from for quite some time. The volatility that we saw during Thursday’s trading session could also be indicative of this since low liquidity typically means that it does not take very much to move a stock price by a fairly large degree. We certainly saw a lot more volatility from this stock’s price action on Thursday than from the S&P 500 Index as a whole.
Earnings Results Analysis
As I stated in a recent article:
It is my usual practice to share the highlights from a company’s earnings report before delving into an analysis of its results. This is because these highlights provide a background for the remainder of the article as well as serve as a framework for the resultant analysis.
Here are the highlights from CNX Resource’s second-quarter 2024 earnings report:
- CNX Resources reported total revenues of $321.443 million in the second quarter of 2024. This represents a 61.72% decrease over the $839.700 million that the company brought in during the prior year quarter.
- The company reported an operating income of $21.9 million in the reporting period. This represents a substantial 96.14% decline over the $567.7 million that the company reported in the year-ago quarter.
- CNX Resources produced a total of 134.0 billion cubic feet of natural gas equivalent in the current quarter. This was almost perfectly in line with the 134.2 billion cubic feet of natural gas equivalent that the company produced in the equivalent quarter of last year.
- The company reported an operating cash flow of $191.8 million for the most recent quarter. This represents a slight 3.47% decrease over the $198.7 million that the company reported at this same time last year.
- CNX Resources reported a net loss of $18.261 million in the second quarter of 2024. This compares very unfavorably to the $474.955 million net profit that the company reported for the second quarter of 2023.
It is basically certain that the first thing that anyone reviewing these results will notice is that every measure of financial performance came in much worse than the company had during the second quarter of 2023. The company’s management did not provide any explanation for this in its earnings conference call or in its prepared remarks. Indeed, the company’s management described this as a very strong quarter in the latter document:
Our high performing operational team continued to efficiently execute our maintenance of production plan with another quarter of strong results. With reduced activity in-basin, we have seen both service costs and commodity input costs remain flat in the first half of the year, and we expect this trend to continue.
The company also promoted its free cash flow in the quarter:
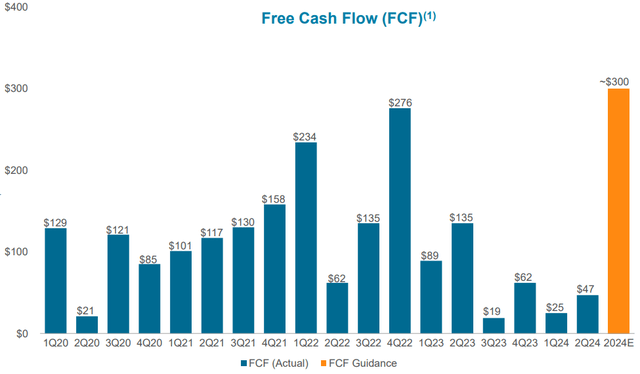
In the second quarter of 2024, CNX generated $47 million in free cash flow, marking our 18th consecutive quarter of free cash flow generation. Since the first quarter of 2020, our cumulative total free cash flow stands at $1.9 billion. We remain focused on successfully executing our original 7-year plan, highlighting our Sustainable Business Model, which we expect will continue to create significant long-term per share value throughout the commodity cycle.
It did, however, note that the claimed $47 million of free cash flow was less than the $135 million that it reported in the same quarter of last year:
While the company states that free cash flow is a non-GAAP figure, it does appear that it is using the standard definition of free cash flow to calculate the above figures. The definition is simply operating cash flow plus asset sales minus capital expenditures. Personally, I would not include the asset sales in free cash flow, but that would only reduce the company’s free cash flow to $40 million (it had $7 million of asset sales during the quarter) for the quarter. Thus, we can see here that the company is doing a whole lot better than the reported net loss would suggest. After all, it is ultimately free cash flow that is most important to most of us since it basically represents the money that is available to reduce debt, pay a dividend, or buy back stock.
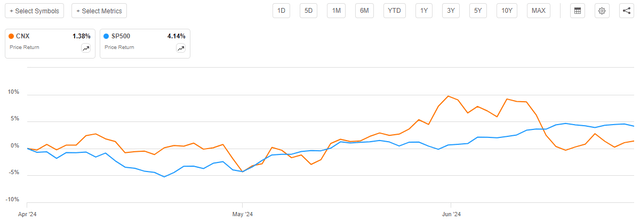
CNX Resources is fairly committed to using share buybacks as a method of rewarding its shareholders. In the second quarter, it used its free cash flow to repurchase and retire approximately 800,000 shares. This may have helped its share price performance somewhat as CNX Resources saw its share price appreciate 1.38% over the course of the second quarter of 2024:
Interestingly, for the first two months or so of the quarter, CNX Resources outperformed the S&P 500 Index. It fell behind in mid-June, however.
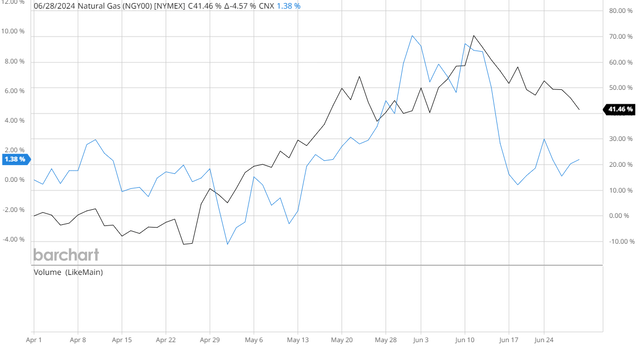
It is unclear how much of an impact the share buyback actually had, though. This chart shows how CNX Resources’ share price compares to the spot price of natural gas over the course of the second quarter of 2024:
Spot natural gas prices are represented by the black line and CNX Resources’ prices are represented by the blue line. We can see that the company’s spot price performed similarly to natural gas, although it dropped off much more than natural gas prices did in mid-June. This could suggest that the share buyback had no real benefit for shareholders and that natural gas prices were the sole contributor to the company’s stock price performance over the period. This conclusion would be in line with statements that I have made in the past about share buybacks being a generally poor way to return money to shareholders.
In the introduction, I stated that natural gas prices in the second quarter of 2024 were lower than they were in the second quarter of 2023. If the chart provided in the introduction was not clear enough to see this, we can see it by looking at the company’s price realizations. Here they are:
As we can see, the average sales price that CNX Resources received in the second quarter of 2024 was $1.60 per thousand cubic feet of natural gas. This was the lowest average selling price that the company realized in any of the quarters over the past year. We do see, fortunately, that the company realized higher sales prices for oil and natural gas liquids than it did in the second quarter of 2023. However, liquids are only a very small fraction of the company’s production. In the second quarter, the company produced a total of 134.0 billion cubic feet of natural gas equivalent. Of that, 121.5 billion cubic feet equivalent was natural gas. Natural gas liquids accounted for 9.25% of the company’s natural gas equivalent production. Crude oil was only 0.1 billion cubic feet equivalent, which is such a small percentage that it is not worth mentioning. In other words, the slightly higher natural gas liquids and crude oil prices were nowhere near sufficient to offset the impact of lower natural gas prices. This is pretty much the case during every quarter, as natural gas accounts for about 90% of the company’s production during most periods.
Financial Considerations
As I stated in a previous article on CNX Resources:
It is always important that we analyze the way in which a company is financing its operations before making an investment in it. This is because debt is a riskier way to finance a company than equity because debt must be repaid at maturity. This is usually accomplished by issuing new debt and using the proceeds to repay the existing debt. That can cause a company’s interest expenses to increase following the rollover in certain market conditions.
As is the case with most domestic exploration and production companies, CNX Resources has not really been affected much by the high interest rate environment that persists in the United States. Here are the company’s total and net interest expenses since late 2021:
As we can see, the company’s interest expenses today are pretty similar to what it was paying back in the fourth quarter of 2021. During that quarter, interest rates were still right around 0% so clearly the rising interest rates have not had much of an impact on the company.
One reason for this is the newfound focus on free cash flow that we discussed earlier in this report. CNX Resources has generated a cumulative free cash flow of approximately $300 million since the start of 2020. The company has used that to reduce its adjusted net debt from $2.545 billion at the end of the third quarter of 2020 (the first full quarter following the end of the pandemic lockdowns in most states) to $2.278 billion today:
Any debt that the company pays off reduces its interest expense. After all, a company does not need to pay interest on debt that it does not have. If it simply buys back its own outstanding bonds, it has the same result as the company would basically be receiving some portion of its own coupon payments, so it ends up being a wash. Thus, the company’s debt reduction efforts have been one major contributing factor to its insulation against rising interest rates.
Another factor that has contributed to the company’s insulation against rising interest rates has been the fact that it can produce profitably even with natural gas prices at their current levels. In the second quarter of 2024, the company’s fully burdened cost of production was $1.03 per thousand cubic feet of natural gas equivalent. This figure is defined in the earnings report:
Fully burdened cash costs include production cash costs, selling, general and administrative cash costs, other operating cash expense, other cash expense (income), other revenue and operating income, and cash interest expense.
Thus, as long as the realized price that the company receives from its natural gas sales is higher than the fully burdened cost of production, it will have positive free cash flow. This means that the company does not need to borrow any money simply to maintain its production and stay in business. Thus, it is able to simply maintain its production and keep earning money until natural gas prices improve sufficiently to justify expansion.
While the company’s adjusted net debt as of June 30, 2024, was $2.278 billion, its GAAP net debt was $2.4076 billion on the same date. This compares to $4.2506 billion of shareholders’ equity. This gives the company a net debt-to-equity ratio of 0.57 today. As regular readers are likely aware, I generally consider anything under 1.0 to be acceptable for an independent exploration and production company so everything looks okay here.
Here is how CNX Resources’ net debt-to-equity ratio compares to its peers:
|
Company Name |
Net Debt-to-Equity Ratio |
|
CNX Resources |
0.57 |
|
Range Resources (RRC) |
0.41 |
|
EQT Corporation |
0.33 |
|
Antero Resources (AR) |
0.61 |
|
Comstock Resources (CRK) |
1.13 |
|
Coterra Energy (CTRA) |
0.11 |
(all figures are calculated using the most recently reported quarterly results, which may not necessarily have a June 30, 2024, closing date)
We can see that all of the companies on the list, except for Comstock Resources, have net debt-to-equity ratios that are well below our 1.0 desired maximum. CNX Resources is on the higher side of this peer group though, as three companies currently have lower levels of leverage. This is not necessarily a bad thing though as it is still close enough to many of its peers that we should not need to worry too much about it.
Valuation
According to Zacks Investment Research, CNX Resources currently has a forward price-to-earnings ratio of 18.06, which is a bit more attractive than the 21.54 forward price-to-earnings ratio of the S&P 500 Index. Here is how CNX Resources compares to its peer group:
|
Company Name |
Forward P/E Ratio |
|
CNX Resources |
18.06 |
|
Range Resources |
14.48 |
|
EQT Corporation |
24.84 |
|
Antero Resources |
49.73 |
|
Comstock Resources |
N/A |
|
Coterra Energy |
12.87 |
(all figures from Zacks Investment Research)
We can see here that the figures are all over the place. However, CNX Resources does not appear to have a particularly compelling valuation right now. It is quite a bit more expensive than both Range Resources and Coterra Energy, and it is above the 12.95 forward price-to-earnings ratio which is the Zacks median for the energy sector.
Seeking Alpha’s Quant ratings system also says that CNX Resources is too expensive to consider right now:
Seeking Alpha
We can see that its forward price-to-earnings ratio is well above the energy sector median. The company looks okay on a trailing twelve-month price-to-earnings ratio, but we generally buy stocks for their future earnings and not because of what they did in the past.
The takeaway here seems to be that potential investors might want to wait for the stock price to come down a bit before buying shares.
Conclusion
In conclusion, CNX Resources posted results that were better than the initial headlines might lead one to believe. The company did report a net loss, but its free cash flow was positive and free cash flow is more important. It also continues to maintain a very strong balance sheet.
The problem here is that low natural gas prices continue to weigh on the company’s revenues and overall financial performance, as well as its stock price. It is difficult to see how the stock will perform well until natural gas prices recover and there is no near-term catalyst to reduce the supply glut that is plaguing the nation. The current valuation also looks a bit high, so it does not make any sense for investors to buy shares in the hopes of a long-term recovery.
