blackred
In this article, I outline how I will allocate the money in my retirement account for the month of May. I use a technical analysis approach consisting of the 10-month exponential moving average (EMA) and a relative strength ratio to determine where my money will go among four ETF choices: SPDR S&P 500 ETF (NYSEARCA:SPY), Vanguard Extended Market Index Fund (VXF), iShares MSCI EAFE ETF (EFA), and iShares Core U.S. Aggregate Bond ETF (AGG). My retirement account only offers me those four ETFs, plus cash. I have two objectives with this retirement account. The first objective is to make money, and the second objective is to outperform the SP 500 index. I want to achieve these objectives as simply as possible, which is why I like to use the 10-month EMA crossover as my strategy. I look to be long the ETFs that are trading above the 10-month EMA, and I look to be out of the ETFs that are trading below the 10-month EMA. It’s a simple strategy that allows me to stay in long term uptrends and keeps me out of long term downtrends, avoiding massive drawdowns. The 10-month EMA is a long term moving average similar to the 200-day moving average using a daily chart, which many people are familiar with. This strategy is not guaranteed to work every time, but I don’t know of a strategy that does work every time. I use the relative strength ratios to determine which ETFs are the strongest, as that’s where I want to allocate my money. Let’s get the current view of the market.
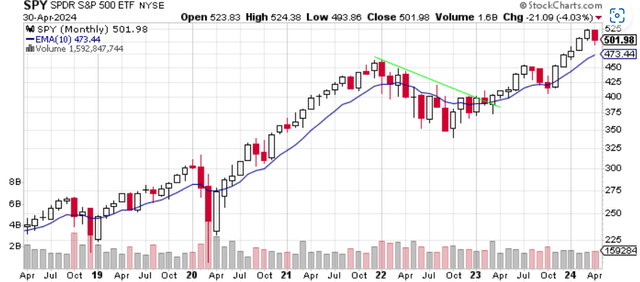
Chart 1: Monthly SPY with 10-Month EMA
Chart 1 shows that SPY lost 4.03% in April. It was the first losing month in the last six months, and the first losing month since SPY closed above its 10-month EMA in November. Despite the loss of over 4%, I like what I see out of SPY. It is in bullish alignment, meaning that SPY is above its upward sloping 10-month EMA. Another bullish sign to me is that SPY is still just percentage points away from an all-time high. SPY could continue to decline in May, but as long as SPY is above its 10-month EMA, I consider SPY, and the market in general, to be in a bullish uptrend.
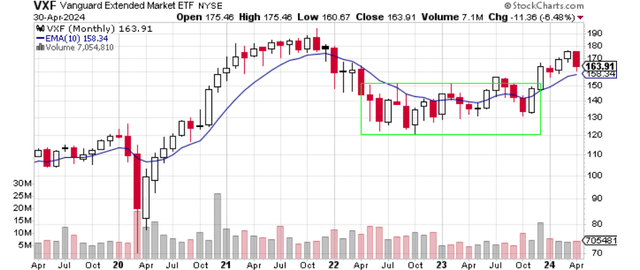
Chart 2: Monthly VXF with 10-Month EMA
Chart 2 shows that VXF declined 6.48% in April. That is quite a setback for VXF shareholders. Despite the drawdown, VXF is in bullish alignment. It is above its upward sloping 10-month EMA so I say that VXF is in a bullish uptrend. A difference between VXF and SPY is that VXF has a way to go before it reaches new all-time highs. It will be interesting to see how long it may take for VXF to reach an all-time high. Perhaps in 2024. Only time will tell.
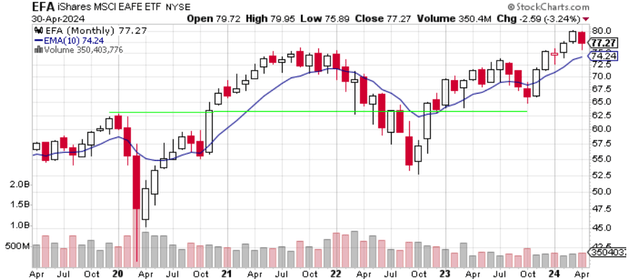
Chart 3: Monthly EFA with 10-Month EMA
Like Charts 1 and 2, Chart 3 shows that EFA lost money in April. EFA declined 3.24% for the month. EFA is in bullish alignment, and so I give it the benefit of the doubt of being in a bullish uptrend. This is why I like using a mechanical system. It takes away the arbitrariness when considering if a stock or ETF is bullish or bearish. Since EFA closed the month above its 10-month EMA, it’s bullish. EFA is close to a new all-time high, which is another bullish indication.
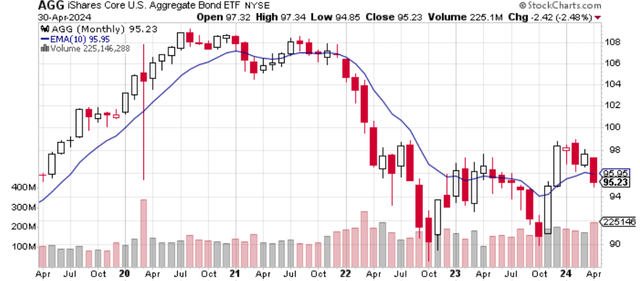
Chart 4: Monthly AGG with 10-Month EMA
AGG lost 2.48% in April. More importantly to me, AGG is now in bearish alignment. Bearish alignment is when price is below a downward sloping 10-month EMA. I do not want to own any stock or ETF that is in bearish alignment. AGG is heavily influenced by interest rates, and maybe Chart 4 tells observers that interest rates are going to be higher for longer. I don’t know what will happen to interest rates, and I’m not concerned about it. Using a technical analysis approach means that I don’t have to study fundamental factors such as interest rates, macroeconomic developments, money supply data, etc. I believe that the fundamental factors are shown in the price. I just understand that price above the 10-month EMA is bullish, while price below the 10-month EMA is bearish.
After reviewing the first four charts, I know that I can allocate money to SPY, VXF, and to EFA. That is because each of these ETFs are in bullish alignment. They are above an upward sloping 10-month EMA. However, I can’t allocate money to AGG. AGG is in bearish alignment, meaning it trades below a downward sloping 10-month EMA. Now I will look at the relative strength ratios to determine which of these ETFs I should allocate my money to in May.
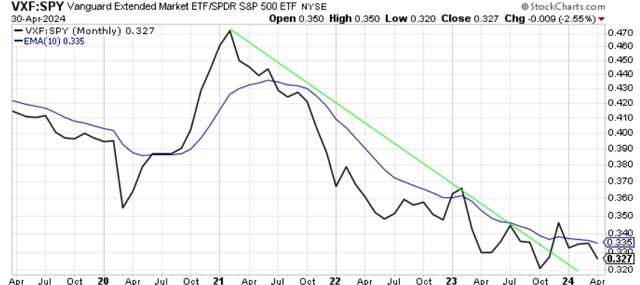
Chart 5: Monthly VXF:SPY Relative Strength Ratio with 10-Month EMA
Chart 5 shows the relative strength of VXF to SPY. Reading relative strength charts is easy to do. The black line is the ratio of the price of VXF to SPY. When the black line is declining, that means that VXF is underperforming SPY. When the black line is rising, that means that VXF is outperforming SPY. I use the 10-month EMA in blue the same way as I do in the first four charts. I want to own an asset that is in bullish alignment. Chart 5 shows that VXF underperformed SPY by 2.55% in April. The VXF:SPY ratio is in bearish alignment. This tells me that while VFX itself is in bullish alignment as shown in Chart 2, I can’t allocate money to VXF over SPY because SPY is outperforming VXF.
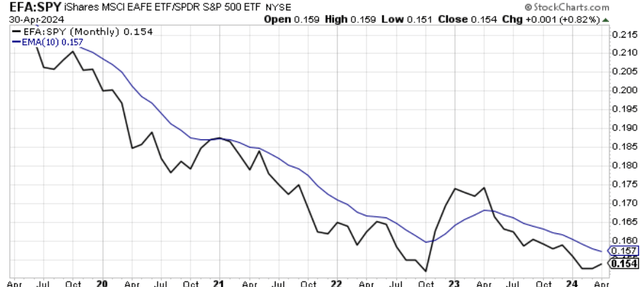
Chart 6: Monthly EFA:SPY Relative Strength Ratio with 10-Month EMA
Chart 6 shows that EFA slightly outperformed SPY in April by 0.82%. That is two consecutive months of outperformance by EFA. Maybe May will be the month that gets the EFA:SPY ratio into bullish alignment. Only time will tell. That being said, the EFA:SPY ratio is still in bearish alignment. This means that EFA is not a candidate for allocation this month.
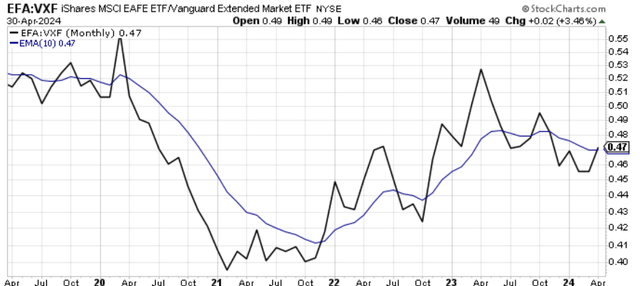
Chart 7: Monthly EFA:VXF Relative Strength Ratio with 10-Month EMA
Chart 7 shows that EFA outperformed VXF nicely in April by 3.46%. The ratio looks to be breaking into bullish alignment territory. Next month will better define this ratio. Again, I won’t be investing in either of these two ETFs in May.
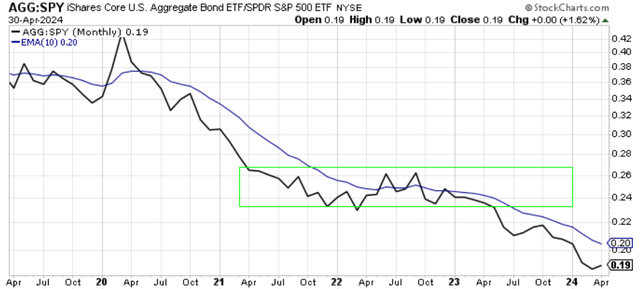
Chart 8 – Monthly AGG:SPY Relative Strength Ratio with 10-Month EMA
Chart 8 shows that AGG outperformed SPY in April by 1.62%. While that outperformance is strong, the ratio remains in bearish alignment, as investors have just preferred equities to bonds for the past year and a half. SPY is where I prefer my money to go to compared to AGG.
In summary, Charts 1, 2, 3 show that the three equity ETFs, SPY, VXF, and EFA respectively are in bullish alignment. This is true even though all three ETFs lost money in April. All three ETFs are trading above their respective 10-month EMAs so all three of them are viable candidates to allocate money to in May. Chart 4 shows that AGG is in bearish alignment, so I will not consider AGG as a viable candidate to allocate money to in May. Charts 5 and 6 tell me that SPY offers the better opportunity compared to VXF and EFA. SPY is outperforming both VXF and EFA using the 10-month EMA as my guide. So, in May, 100% of my investment funds in my retirement account will be allocated to SPY. I use this strategy one month at a time, and next month I will go through the same process to determine where my money will be allocated.
