
Fabrice Cabaud
Investment Thesis
Based in Dallas, Texas, Primoris Services Corporation (NYSE:PRIM) is in the business of providing infrastructure services. Operating mainly in the U.S. and Canada, the company offers a broad range of construction, replacement, fabrication, and engineering services to a diversified customer base through its two primary segments, (i) utilities and (ii) energy.
I am particularly interested in the energy business for several reasons:
- It provides services to the LNG, electricity and construction markets and has notable tailwinds behind it from the global demand for data centres. PRIM’s involvement in the development of data centres is a short-term competitive advantage as 1) total backlog is ~$10.1Bn [slightly down YoY on the back of its record FY’23 number], and 2) new data facility starts are driving global electricity demand.
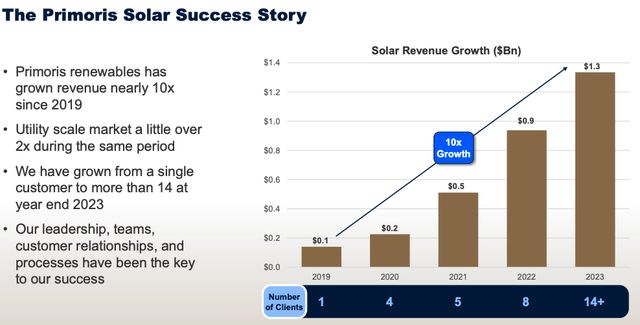
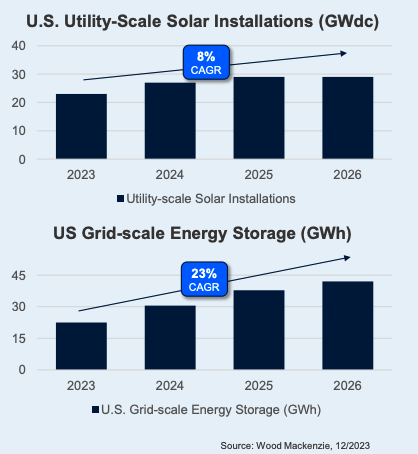
- PRIM’s renewables portfolio is another structural differentiator to competing energy services providers that are scaled to traditional markets alone. Since FY’19, solar revenues grew ~10x versus ~2x growth for the broader market (Figure 1), with 14 customers vs. just 1 back then. Industry economics suggest ~8% CAGR in US solar installations by FY’26E. As I think to US grid storage, projections are for +23% CAGR for US grid storage by FY’26E (Figure 2). The thinking is renewables may play a role in preventing grid congestion and support more capacity. I can’t say I disagree.
- Management noted it has 2-3 solar jobs in the pipeline of ~$400-$420mm notional value range, positioning PRIM well to continue its growth in the segment (Q1 solar revenues were ~$400mm).
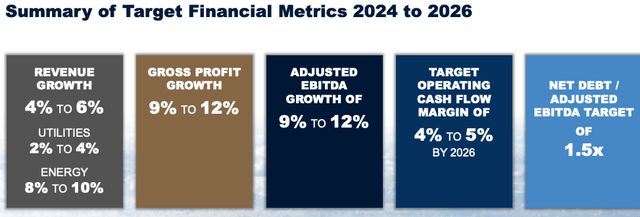
- Recently revised projections for 4-6% sales CAGR by FY’26E inc. an 8-10% growth estimate for the energy business. My view, it’s the key growth lever moving forward.
I am buy on PRIM due to 1) strengthening fundamentals, 2) momentum in its energy business, and 3) valuations supportive to $59/share at ~14x NOPAT, with potential CAGR of 24% to FY’26E from this mark. The valuation calculus is skewed heavily in our favour with up to 50% margin of safety on these conservative assumptions [PRIM currently trades ~17x NOPAT]. Net-net, rate buy.
Figure 1. There is a great investor presentation PRIM posted in April about its long-term initiatives. I’d encourage all to check it out thoroughly.
PRIM Investor Presentation
Figure 2.
PRIM Investor Presentation
Why PRIM is a great business
One of the primary challenges in both construction/engineering and energy businesses is that they suffer from commodity-type economics due to the nature of their industries. It is typically 1) the lowest cost provider, or 2) the differentiated offering that sees above industry returns on capital. The second risk is that when ROICs shoot higher, they tend to show weak persistence and fade quickly (see: Credit Suisse, HOLT Wealth Creation Principles, “Don’t Suffer from a Terminal Flaw, Add Fade to Your DCF”, Holland & Matthews [2016] pp.2, “Introduction”). You need a proper recovery of your underlying assets in this space, including (i) capital and (ii) returns on capital.
PRIM deals with these issues in several ways:
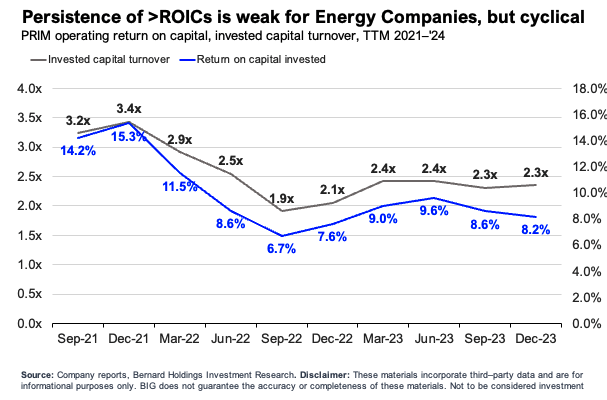
- Regarding the fade business returns, as much is true for PRIM in the last 2yrs, with ROICs down from ~16% in FY’21 to ~8% in the TTM (Figure 3). I am acutely aware of the cyclicality of returns in these companies. As discussed, commodity-like economics mean the product or service is undifferentiated in any consumer-important way, such as appearance, or functionality.
- Thus, margins are low (highly competitive with little differentiation), but some –like PRIM – enjoy highly productive assets that turnover capital >2x every 12 months. This means 1) it enjoys pricing as a competitive advantage [gross margins of ~10-11% are 6th lowest vs. industry, with SLND, FLR, MTRX holding substantial advantages vs. peers with <6% gross margins]. If PRIM can grow with <12% gross on sales, it can’t be beaten on price in most instances.
- Renewables have attempted to deal with this issue by providing a point of higher-margin differentiation. Unfortunately, some classes (particularly wind) haven’t provided the risk capital unlock investors were hoping for –solar, on the other hand, has. The consumer economics are brighter (no pun intended) as (a) there is regulatory support/incentives to install it, (b) we’ve seen large uptake of solar farms globally, and (c) consumers often may (emphasis added) pay slightly higher prices for the installation, in the hope for savings down the track.
- Second, the productivity of its operating assets indicates ‘good bang for our buck’ here, with each $1 of capital employed into the business rotating ~$2.30 in revenue. Critically, 1) this is PRIM’s main return driver [vs. margins], and 2) it has come down from highs of ~3.4x in FY’21].
- My view is that if it can (i) maintain a rate of turnover of >2x on its capital deployments then (ii) the market will continue to value it at ~1-1.5x capital [discussed below], and (iii) management will continue ploughing funds back into PRIM at above-industry-average returns [industry avg. ROC is ~6%, PRIM is pushing ~8-10%].
Figure 3.
Company filings, author
Attractively valued with growth opportunities ahead
I believe PRIM is trading at a discount due to 1) the value of its implied growth rates from FY’24–’26E, 2) outsized growth of its energy business, and 3) the fact investors look to underappreciate this with PRIM at 0.4x sales. My view is that PRIM’s growth opportunities in the solar and industrial construction sectors are currently underappreciated by the market.
Valuation insights
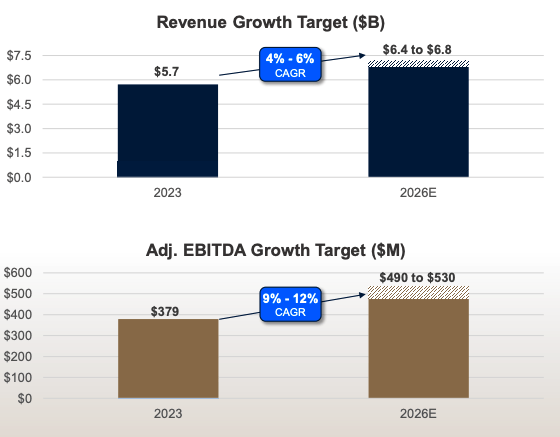
- Management is constructive on FY’24-26E sales + earnings growth, in line with industry forecasts. It sees ~4-6% total sales CAGR with 8-10% CAGR in the energy business, as mentioned. This gets us to $6.4–$6.8Bn in sales on ~$530mm adj. EBITDA at the upper end (Figure 4). This could compound pre-tax earnings by 9-12% indicating 2–2.25x operating leverage. Say we get ~2x, then every $1 of new sales is worth ~$2 in pre-tax earnings. At current 2yr average 13x NOPAT this could equal ~$26 in market value for every new $1 in revenues.
Figure 4.
PRIM Investor Presentation
PRIM Investor Presentation
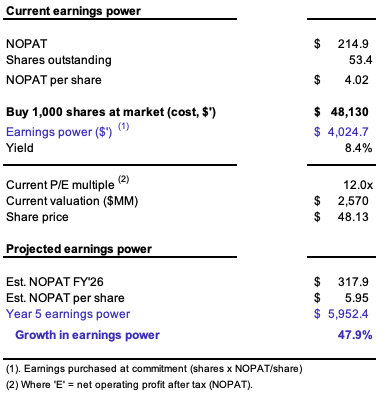
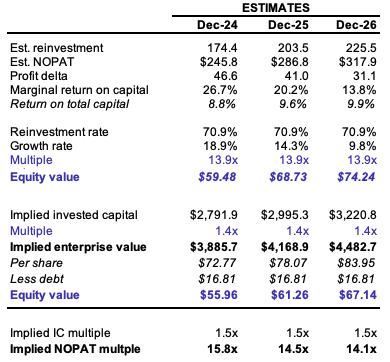
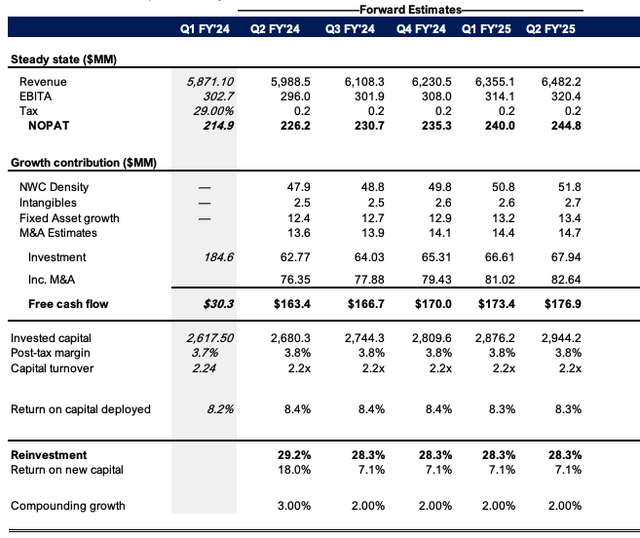
- My FY’24–’26E estimates call for 1) 5.3% compounding sales growth [in line with consensus], 2) ~5% pre-tax margin with 23.5% tax rate, and 3) the rate of revenue growth sported by an investment of ~$0.55 per $1 of new sales [predominantly in working capital + fixed asset growth]. This gets me to $6.5Bn in FY’25 and ~$7Bn in FY’26, slightly ahead of management [see: Appendix 1]. Whilst I’m aware this is optimistic, consider that 1) my estimates are the company’s historical value drivers from FY’21–’24, such that 2) if it continues operating in a similar fashion to the past 3 years, these projections aren’t unreasonable.
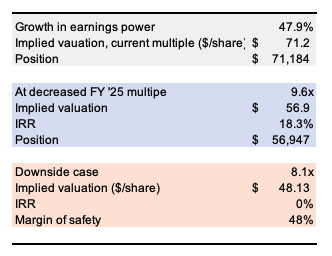
- On the upside, these estimates imply ~47% growth in earnings power from $4.02 NOPAT/share to $5.95 [1,000 shares equity would = ~$5,592 in owned earnings under these assumptions]. On the downside, my view is 1) current multiples are still conservative, and 2) the margin of safety is also ~48% based on this.
Figure 5.
.
Author’s estimates
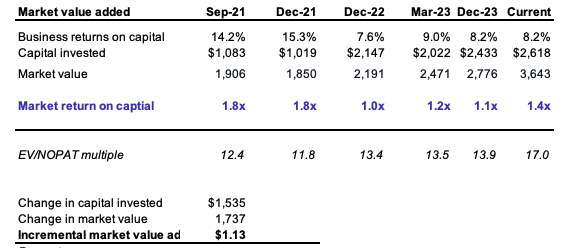
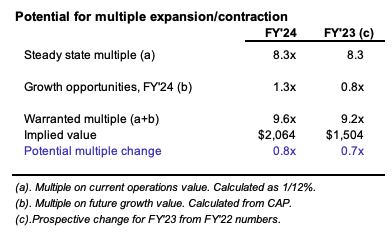
- Despite 1) book capital +$1.6Bn since FY’21 [there’s now been $2.6Bn put into PRIM vs. ~$1Bn 3 years ago], and 2) slowdown in capital efficiency due to this [capital turns are ~2.2x vs. >3x historically, as mentioned], the market still values PRIM at ~1.4x capital – in line with 3-year range. There’s been notable upsides from FY’22 inc. EV/NOPAT stretching from ~13x to 17x as I write. Management’s decisions have been valued highly, with each $1 of incremental capital put to work in the business translating to ~$1.13 in market value (1.13x multiple).
- The question is 1) what multiple will the market assign to the business’s new investments and/or profits, and 2) will PRIM’s earnings become more valuable with each $1 of incremental capital, or not?
Figure 6.
Author’s estimates
- My views to the above are that 1) it will assign a 1.3x multiple to its new investments [slightly off current range] but could reduce its value on forward NOPAT by ~0.8x, getting us to ~14x vs. the current 17x. In that vein, my FY’24–’26E numbers value PRIM at ~$59 today, with CAGR of ~24% to FY’26 reaching $74/share, or ~1.5x capital. This assumes 1) ~26% marginal return on new investments, with 2) this rate fading to ~14%. If I assign the current 17x multiple as an upside scenario, this gets us to $75–$93/share.
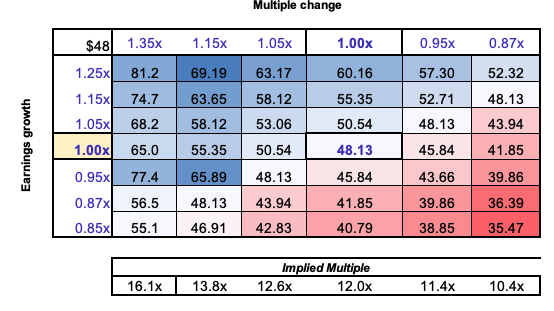
- The valuation calculus is skewed to the upside with 5% change in multiple deriving $53/share with FY’24 growth estimates of ~15-20% (Figure 9).
Figure 7.
Author’s estimates
Figure 8.
Author’s estimates
Figure 9. Note– uses EV/NOPAT multiple
Author’s estimates
Risks to thesis
Downside risks to the thesis include 1) <8% sales growth in the energy business [worse than embedded expectations], 2) regulatory risks in the renewables business, 3) sudden increase in capacity, hurting the broader industry, 4) capital intensity increasing [reducing asset productivity], and 4) the spate of global risks that could spill into equity markets, including the rates/inflation axis, and the geopolitical situations around the world.
These risks must be factored in before proceeding any further.
In short
PRIM’s business offers points of differentiation from peers who endure commodity-like economics which presents as a competitive advantage in the form of 1) >2x turnover on capital with each $1 invested returning ~$2.20 in sales, 2) outsized sales growth of 8-10% projected in the energy business vs. 4-6% in the base business, and 3) an extensive reinvestment runway that allows management to plow ~100% of earnings on avg. to fund growth. My view is PRIM is worth ~$59 today (~14x NOPAT), which could CAGR ~26% to ~$74 if management can reinvest ~75% of earnings at a 5% sales growth rate ahead, producing ~8% returns on capital [+200bps advantage vs. the industry avg.].
Critically, at 14x, this is below the current 17x NOPAT where PRIM trades today, illustrating the case is heavily skewed in our favour.
Net-net, I rate PRIM a buy.
Appendix 1.
Author’s esitmates

