Wolterk
Every real estate investor, including REITs, must assess and choose among potential investments. These choices ideally should consider not only price but also desired property type, cash earnings, earnings growth, and risks.
The choice of investments also should reflect the source and cost of the funds used. It is one thing to buy a property with cash on hand. It is something else to take on debt to raise some or all of the cash.
More complexity is added if you sell part of your real-estate company to raise funds for investment. But this is exactly what REITs do when they issue stock to raise cash.
An individual investor faces relatively straightforward tradeoffs. These may not be hard to judge.
REITs, in contrast, need some approach to evaluating when an investment makes sense for them. This generally involves a spread between what an investment earns and what it costs. Let’s discuss ways of doing that.
Which Spread?
When an investment is supported by issuing stock, the growth of per-share earnings directly reflects the spread between Return on Equity or ROE for new investments and the AFFO Yield [ratio of AFFO to Market Cap, with AFFO being Adjusted Funds From Operations]. STORE Capital invested based on that spread.
But the whole world speaks in terms of the spread between cap rates and interest rates or cap rates and WACC, defined below. As we will see, this is unfortunate because it detracts attention from things that directly matter.
My recent, related work went into more detail about the underlying theory. We will start by discussing two of its results.
In short, one can derive two relationships from the seminal Proposition II of Modigliani & Miller, first published in 1958. In a form useful for REITs, they are as follows.
One can find the ROE, obtaining:
RP Drake
where DR is the Debt Ratio and CC is the ratio of corporate costs to Net Operating Income or NOI. Corporate costs include mainly G&A costs for net lease REITs but include significant other costs for other REIT subsectors. Note that this formula determines ROE as a function of four known quantities. I learned this formulation from three-time REIT CEO Chris Volk and use it frequently.
We can note also that ROE enters into the rate of AFFO/sh growth from any investment of cash. In the specific case of cash raised by issuing stock, the rate of AFFO/sh growth is proportional to the spread between ROE and the AFFO Yield.
Instead of doing calculations that are directly related to earnings growth, many REITs assess investments using Weighted Average Cost of Capital, or WACC. Let’s discuss that.
The second relationship that can be derived from Proposition II defines the usual Weighted Average Cost of Capital or WACC. It is
Note that (1- DR) is the “equity fraction” — the fraction of property value supplied as equity. However, a problem lurks within WACC.
The problem is that Return On Equity here, often described as a “cost of equity,” has no objective definition in this context. (If you plug in the definition above, then you end up with everything canceling out and are left with 1=1.) Instead, one can find any number of ways to determine ROE in the context of WACC, with no objective way to say which is correct.
Let’s look at examples.
Competing versions of WACC
My examples today are drawn from what NAREIT calls the “Free Standing” REIT sector. These REITs, often described as “Net Lease” REITs, generally rent their properties using triple-net leases under which the tenant is responsible for all insurance, maintenance, and tax costs.
We will review the calculations of WACC by three of the net lease REITs. This will be enough to get you a feel for the variations.
NNN REIT
We start with NNN REIT (NNN). The relevant slide in their investor presentation is this one:
Investor presentation (NNN REIT)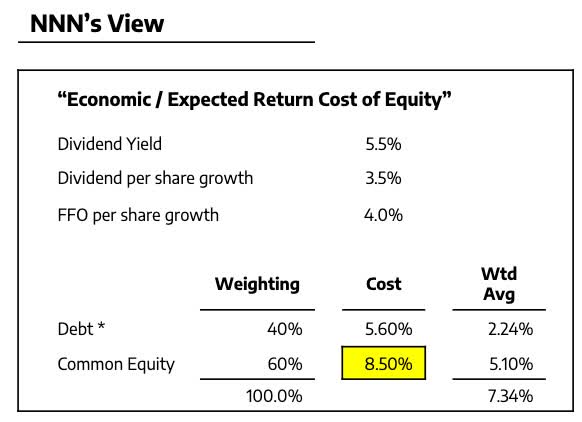
In the description of CFO Kevin Habicht, that 8.5% highlighted in yellow seems to be something of a WAG, just trying to be conservative. They just add what seems like enough to the dividend yield.
Using numbers up in that 8% ballpark worked really well in the 2010s when AFFO yields were small. But the problem with trying to be conservative based on a WAG is that you don’t know when it won’t work.
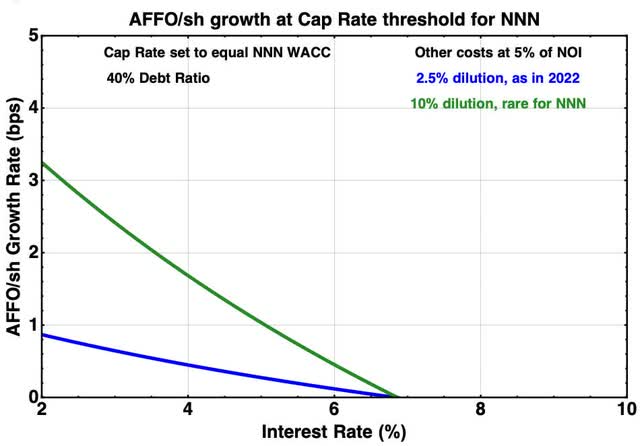
With today’s larger AFFO yields, this approach gets sketchy. This next chart shows why:
The calculation producing this chart assumes the Cap Rate is set to satisfy the WACC threshold shown in the above slide. Then it evaluates the AFFO/sh growth rate against interest rates for two different levels of dilution.
The big thing you see here is that this growth rate depends very strongly on the interest rate. Using the WACC threshold is a poor way to obtain some desired rate of accretion.
Plus it can lead you to make investments of little value. During the price bump in late 2022 NNN issued some equity. It was the right qualitative decision to do this at a relatively high price. But the CfO Yield (near the AFFO Yield) was 7.4%. My conclusion from analyzing this in April 2023 was:
They diluted shareholders by 3.1% at a dividend yield of 4.9%. From the point of view of increasing per share earnings, this dilution was pointless. The earnings growth produced by the 2022 acquisitions (most showing up in 2023) would have been the same if they had issued no equity.
In my article this year, I looked more at their history. The same management team failed to growth per share earnings in the early 2000s.
I appreciate the conservative approach and do hold some NNN. But the use of a WAG rather than sound analysis seems to me to put growth of shareholder value at more risk.
Realty Income
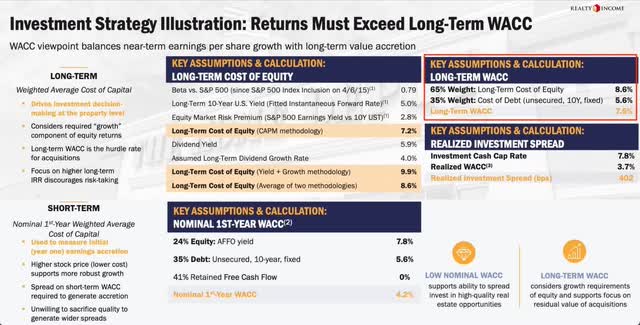
Realty Income (O) has long had a slide about WACC in their decks. Here is the current version:
Feel free to let your head spin as long as you like, looking at this. One salient point is that they come up with three different values of WACC.
No one of them is clearly correct. Instead, this just illustrates how subjective and ill-defined “Cost of equity” is in the WACC rendition of Proposition II. You pick whichever suits your fancy and invest accordingly.
It is the value within the red added box that is most relevant here. But in contrast to NNN, the “Long-term Cost of Equity” (the ROE in the above) is not from a WAG. It is instead from the gobbledygook you see in the middle section. It will change as dividend yield changes and as the 10-year treasury rate changes.
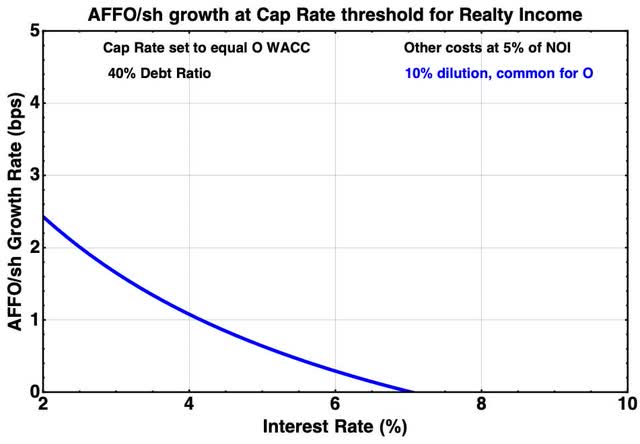
To assess impact of their rule on the growth rate of AFFO/sh, I took Beta and the Equity Market Risk premium to be fixed, took the Treasury yield to be 100 bps below the REIT interest rate, and used a fixed 5% dividend yield. This is the implication, for 10% dilution:
The growth rate is less at low interest rates than one finds for NNN because the acquisition cap rate is adjusted downward as interest rate decreases (as indeed is how Realty Income invested). But the growth rate gets really small above an interest rate near 5%.
In recent years, Realty Income has been effective with their mergers at growing AFFO/sh. But as I concluded in an article last year, their recent routine acquisitions have not been accretive.
Agree Realty
Here is the corresponding slide for Agree Realty (ADC). It has the virtue of simplicity.
Agree Realty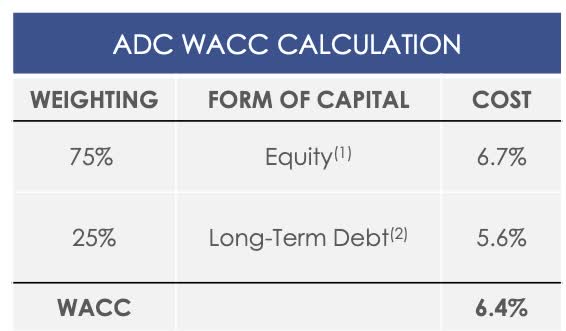
Here, the cost of the equity is taken to be the AFFO yield based on their current forward equity sales. That makes a lot more sense than anything that Realty Income or NNN does because the growth rate of AFFO is directly proportional to the spread between ROE and AFFO yield. The amount of debt also reflects current issuance.
What the method Agree uses does is to make interest rate and Cap Rate independent in the threshold calculation, since it is now the stock price that sets the “cost of equity” via the AFFO yield. So in the plot below the interest rate is set at a current value of 6% (the results are not strongly sensitive to the exact value used).
When I chatted with Joey Agree recently, he was adamant that their WACC was the best. This is not really a surprise, from any CEO. That said, I concur with him. But again, there can be no objective standard for assigning a value to a dependent variable forced to masquerade as an independent variable.
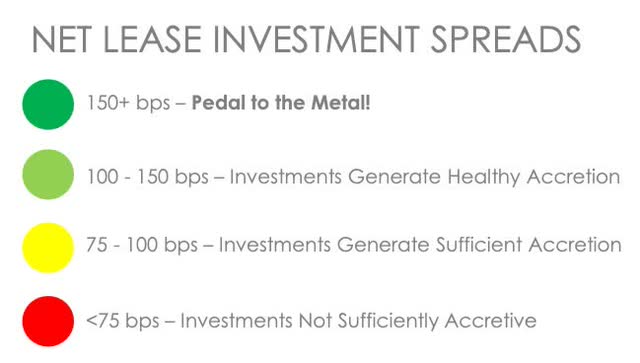
As important as the details of WACC is whether you impose a threshold spread (which has the effect of compensating for the corporate costs mentioned above). Agree is the only one of these three that does that explicitly. Here is their relevant slide:
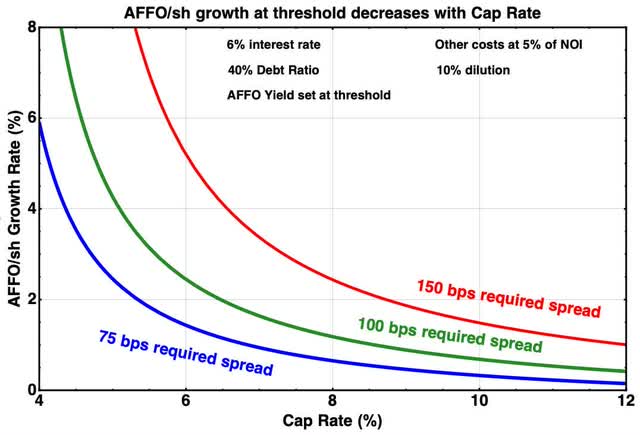
Using the approach of Agree also changes the details of evaluating AFFO/sh. Now, the WACC implies an AFFO Yield at threshold for any given Cap Rate and interest rate.
Using that AFFO Yield value, the next plot shows the growth rate of AFFO/sh against cap rate for three possible WACC-spread thresholds.
The good news, compared to the two previous cases, is that the approach of Agree prevents you from making dilutive investments. But once again, it does not assure any specific rate of AFFO/sh growth.
So we are still left with the question of whether the growth produced by a specific investment represents a reasonable risk. The approach of Agree Realty does not help in understanding the answer to this question.
What Should Net Lease REITs Do?
The Net Lease REITs should underwrite their investments by direct reference to the amount of AFFO/sh growth they will produce. This is not rocket science.
It would be best to retire the entire WACC and WACC spread analysis, although that may be too much to ask. But at least they should use thresholds like Agree does.
They should also understand that investment spreads must increase as cap rates do, in order to obtain the same amount of growth. A reader of mine with extensive direct experience in real-estate investment was a bit shocked that the REITs show no sign of understanding this.
What Should Net Lease REIT Investors Do?
The business model of owning and leasing freestanding properties using triple net leases is a powerful one. It can be an excellent way to find secure and growing cash earnings. The REITs offer a way to participate.
So net-lease REIT investors are fortunate. Still, they face some first-world choices.
These REITs vary in several ways. They vary in:
- their approach to property type
- the amount of retained earnings
- the desired emphasis on issuing stock to support growth
- how they describe their investment requirements
The main outcome of these variations is that the rate of AFFO/sh growth they will produce varies. The growth varies both structurally and in how it will respond to changes in the markets.
None of the three REITs discussed above understand theoretically how to produce a desired level of AFFO/sh growth, at least based on their disclosures. My expectation would be that they would say these things:
- Agree Realty: Our superior property selection will generate superior comparative results
- Realty Income: Our low cost of capital will imply that we outperform
- NNN: Our conservative approach will protect our investors
These are all strengths. But the rate of growth each of these REITs will produce depends on details that are not included in their models.
Lacking good theory, they need specific and complete modeling of their investment plans to assure that investors benefit. We’ve seen NNN fail at this, as is described above. Based on numbers and analysis in my article from last October, my view is that Realty Income also failed, with their ATM stock issuance in the third quarter last year. Agree Realty, in contrast, has made good choices so far.
In contrast to these cases, Essential Properties (EPRT) likely does understand AFFO/sh growth, having management out of the Chris Volk coaching tree (to use a football analogy). Their approach to property selection makes a fascinating contrast to the approach of Agree Realty. I personally like both of them.
The outcome here for me is that in the long run my preference would be to hold EPRT and ADC. But today I am still invested in the higher dividend yields from NNN and W. P. Carey (WPC). This matters for an income investor.

