flavijus/iStock Editorial via Getty Images
We are living through not unprecedented times, but a market environment rarely seen. So rare, that I suspect a large portion of today’s actively engaged investment audience either has not experienced something like this, or at least has not learned about it. Market history can be very helpful, but not if you only get it in sound bites on TV or social media.
Now to focus on the present, here’s my quick summary of common US stock market sentiment during the post-pandemic period, say, 2021 through present:
- The S&P 500 (SP500) became the place to be, thanks in large part to how easy it became to just “index it” through 401k plans with limited choices. The dramatic increase in attention from investors on that index, as the Dow Jones Industrial Average, a less tech-heavy index, faded from its former stardom.
- The Nasdaq 100-Index (NDX) began to capture the hearts and wallets more, thanks to a few stocks that simply took over the market capitalization leadership tables, not to mention the media’s attention.
- This caused the S&P 500 to be more dominated by Nasdaq 100 giants than ever before, with the possible exception of the dot-com era. As such, the current market started to resemble that one, but it has not become common knowledge to investors. The bottom line is that the S&P 500 keeps rising, largely on the back of the impressive rise in Nasdaq 100 leaders. This has been due more to multiple expansion and hope about continuation of past historic earnings growth than anything related to “reasonable price” investing.
- The more the Nasdaq 100 started to break away from everything else, the more narrow the market’s attention has become. It has reached the point where big money managers who run active portfolios have no choice but to own the big Nasdaq 100 names, or take on major career risk for not keeping up. Again, very dot-com bubble-like sentiment.
- It has now reached the point where even many of the Nasdaq 100 stocks can’t keep pace with the “Magnificent 7” at the top. In other words, as the title of this article states, the Nasdaq 100 can’t even keep up with itself!
This is a warning sign to all investors except those who have shunned the top Nasdaq 100 stocks. And I don’t know if there are many of those left. Below, I make the case not that there is some imminent crash coming (though I never rule that out). This “warning” is more that whatever does eventually come along to break sentiment will cause selling pressure to feed on itself because there is so much money crowded into those big stocks. It will be a market train wreck, a la 2000 and 2008.
The Invesco Nasdaq 100 ETF (NASDAQ:QQQM) might be the biggest ETF that investors have not heard of. At $30 billion, it is certainly big enough. But because it is overshadowed by the Invesco QQQ Trust (ETF), a 25-year-old Nasdaq 100 tracker with its own TV commercials and a robust options market attached, QQQM might be overlooked. Why have 2 that do the same thing, from the same issuer?
Well, QQQM has a lower expense ratio, but its options market is puny compared to QQQ, so that leads me to believe Invesco introduced QQQM in 2020 to have a lower-cost version of QQQ for long-term investors. I tend to use QQQ, since I do a lot of options work and am generally a tactical investor, not buy and hold. But QQQM is essentially a clone, and interchangeable for this analysis.
I’ll use QQQ for the charts below that need its much longer history. I’ve also included a pair of other Nasdaq 100-based ETFs for comparison here. One is the equal-weight version of the same index, and that will be very important in a moment. The other is one of several covered call ETFs that target the Nasdaq 100 index.
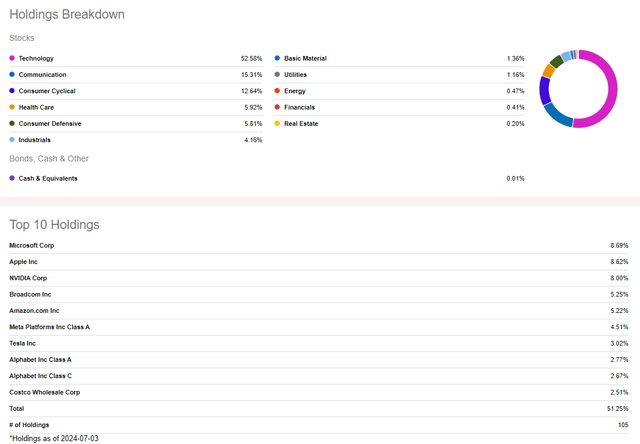
Here is what QQQM looks like from a high level, sector and top 10 holdings standpoint. No surprises here. Tech dominates, and communications and consumer cyclical are each confined primarily to a couple of huge stocks each. You can see the familiar mega-cap names below, and that more than half of QQQM’s assets are invested in just 10 stocks (really 9 since Alphabet has 2 share classes).
But my approach to this is NOT to stay on the sidelines. It is to use many modern investment tools to try to squeeze value out of this potential melt up in a small group of stocks, while being ready to pounce on the eventual hard reversal to the downside. My approach starts with looking for where the puck is going, as Wayne Gretzky would say. Not where it is. Or, as I used to tell my investment advisory clients when I was an advisor:
“You don’t need me to tell you that QQQ is flying higher, and you don’t need me to buy it for you. But you might need some help figuring out how best to navigate what’s happening inside that 100-stock basket and how much exposure to have to it at different points in time.”
Of course now I don’t tell anyone what to do. I just write about what I see, and every reader is on their own. So my key points on how I view the Nasdaq 100 at this stage of its impressive cycle starts with the idea that there is less to it than meets the eye.
How the Nasdaq 100 is outperforming itself!
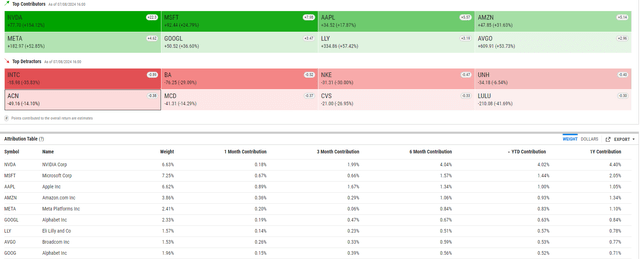
I compiled this to show how the stocks in the Nasdaq 100 have contributed to this year’s QQQ performance so far. Summary:
- QQQ is up about 22% in 2024, through July 5 close. So the “average” of those 100 stocks is up about 0.22%, since 100x 0.22% = a 22% gain.
- But when we look stock by stock, we see that only 17 of the components are doing better than that average.
- HOWEVER, since many of those are also giant weightings in QQQ, that lifts the “market” performance well exceeding what the 100 stocks are doing on average. As we will see below, this is why there is a historically large gap in returns of QQQM over QQEW, the equal-weighted Nasdaq 100 ETF.
- About 40 of the 100 QQQM stock holdings are DOWN year to date. So you say the Nasdaq is way up, eh? Ask holders of those stocks in red if they feel that way.
- The rest of the stocks highlighted in black have contributed a little or less than average to the QQQM return. But in reality, many of those just cancel the ones in red.
- Conclusion: the Nasdaq 100 is not flying high. About 1/3 of it is (that first column). The rest are at best offsetting each other.
YCharts (SungardenInvestment.com)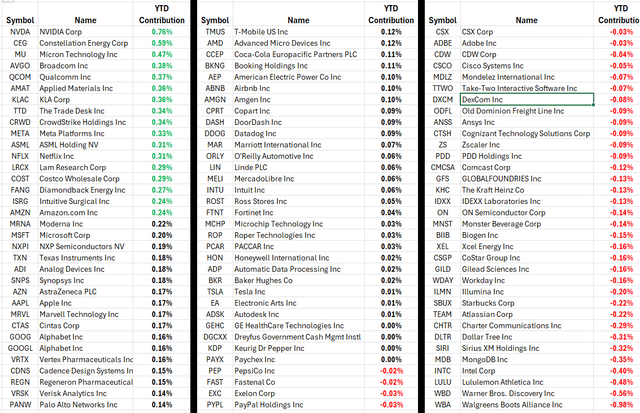
The Nasdaq 100’s optical illusion
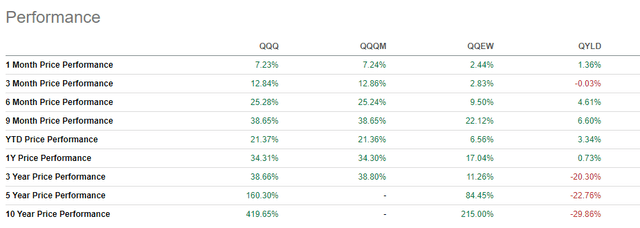
Here’s a performance table using those same 4 ETFs from earlier. However, the key ones are QQQ (or its clone, QQQM) and QQEW, since we know that covered call strategies are essentially left behind when the Nasdaq 100 runs amok as it has over the past 3 years.
Check that table above closely: the 3-year return (not annualized) of QQQM is about 39%, so more than 12% a year. But those same 100 stocks, when equally weighted? 11%! That’s less than 4% a year. Some bull market… not.
The good news: this can continue until… who knows when? That would be what I’d call the “second half of the 1990s” scenario. Valuations don’t matter, investors pile on and pile on some more. And the comments section here and elsewhere are filled with chest-beating QQQ warriors, feeling invincible. And, ardent QQQ bears feeling terrible, over and over again, at every point since the end of 2022, when as many have already forgotten, that 30%+ return had a minus sign in front of it.
In fact, here’s a look at the calendar year history of QQQ since its inception, 24 full years in total. Summarized: 6 down years, but 5 of those were down more than 30%. And 8 years when the return was more than 25%, in addition to 4 more years up 18-20%. That’s how those longer-term figures in the chart above get so gaudy.
Yahoo Finance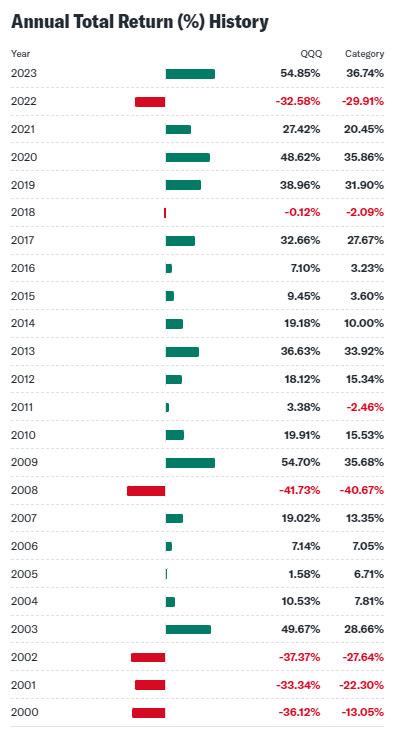
The bad news: markets are still cyclical
If someone does not believe markets are cyclical…that is, that the more they surge, the more likely they are to plummet after that cycle runs its course…that’s their right. This was the dominant sentiment in 1998 and 1999, as well as in 2006-2007. For me, the task is not guessing where the Nasdaq 100 will go, but trying to determine where the best reward/risk trade-off is at any point. And, how to try to profit from that.
Currently, we have one of the highest periods of short-term outperformance of QQQM over QQEW, which means that the biggest Nasdaq 100 stocks are carrying the load. It can get higher, but historically not much higher. That favors a move toward equal weighted investing in the near future.
This is studied and cited constantly (including by me) regarding the S&P 500. But it is as prominent in the Nasdaq 100 as ever. Cap-weighting has trounced equal-weighting, in part because of an area of the markets I track and participate in closely: ETFs. So much money has flowed into them, the market of stocks we used to appreciate is now more of a herd mentality.
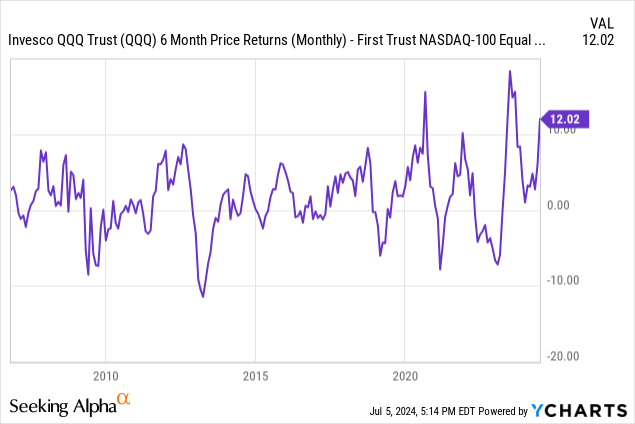
Is that going to last forever or just a little while longer? I don’t know. I just know I am adapting to the new reality. And that means looking to exploit what may be pending inefficiencies that “mainstream” investors are not looking for, since they think the “market” is doing so well. But that chart above shows that increasingly, company size matters a lot. Ask a small-cap investor!
2000: a historical similarity
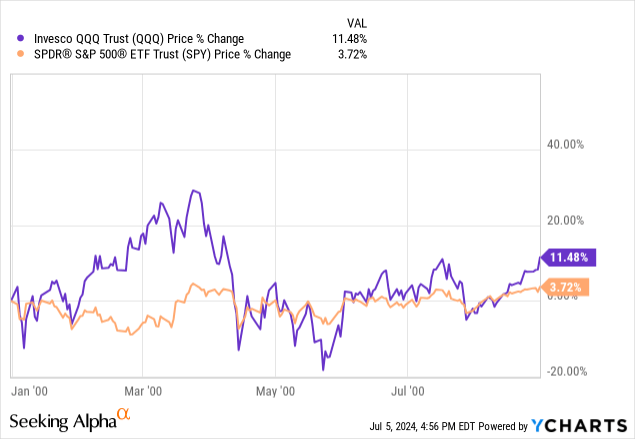
I remember quite well when QQQ spiked and left SPY in its dust to start 2000. This was after a 1999 in which much of SPY’s gain was due to the big QQQ holdings propping it up. But then, with very little fundamental rationale to it, QQQ cratered and recovered. Here’s what 2000 year to date looked like as of the end of August that year.
And below, here is what it has looked like this year, through early July. Not as dramatic, but QQQ/QQQM started to pull away.
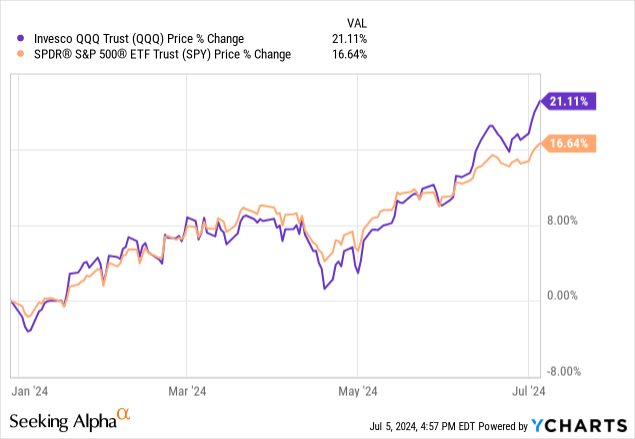
One reason SPY has kept pace better this time around is that the 2 ETFs are much more closely aligned in terms of holdings. As we see below, 86% of QQQ’s holdings are also in SPY.
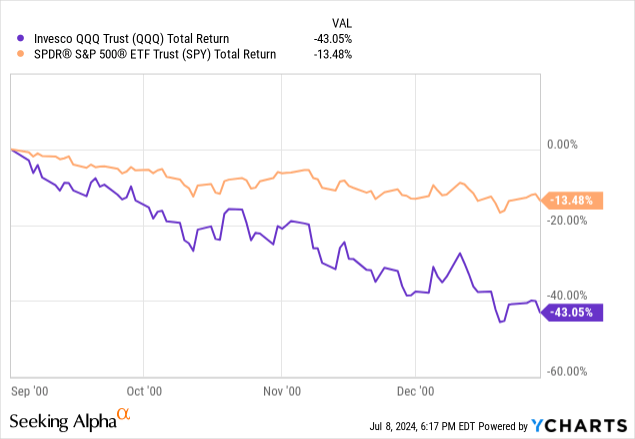
And here’s how the rest of 2000 went. QQQ down 43%…in 5 months! I don’t have ready access to Nasdaq equal weight data from that period, but we see that SPY held in relatively well. This is an indication that back then, being in anything apart than “what had been working” through the summer of 2000 was a relative winner. I am not the type to consider -13.5% in 5 months a “win” by any means, and that’s why I discuss how I’m investing through this most strange part of the market cycle, below.
Below is probably the most striking view of this “QQQ fueling the rise of SPY” observation. Of the 9 largest contributors to SPY’s 2024 gains so far, 8 of them are also the biggest contributors to QQQ.
What is actionable here? (to me, at least)
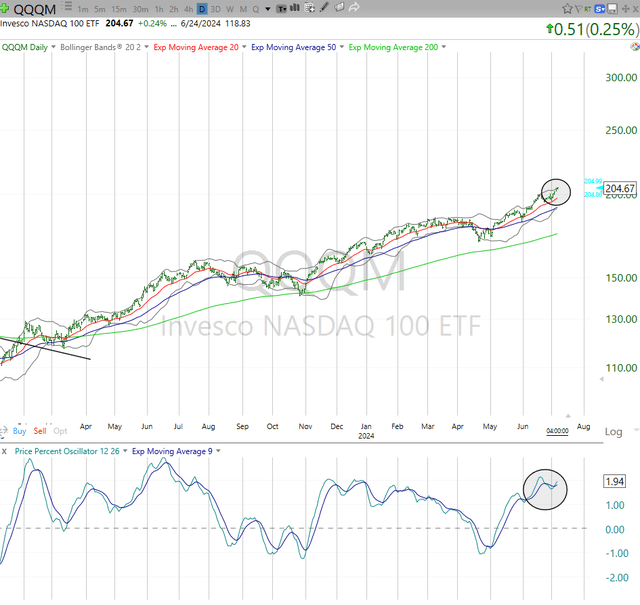
As noted earlier, this can go on for a while. And I am ready, willing, and able to try to get my fair share of that if it continues. QQQM looks like it is starting another leg higher. Very 2000-like.
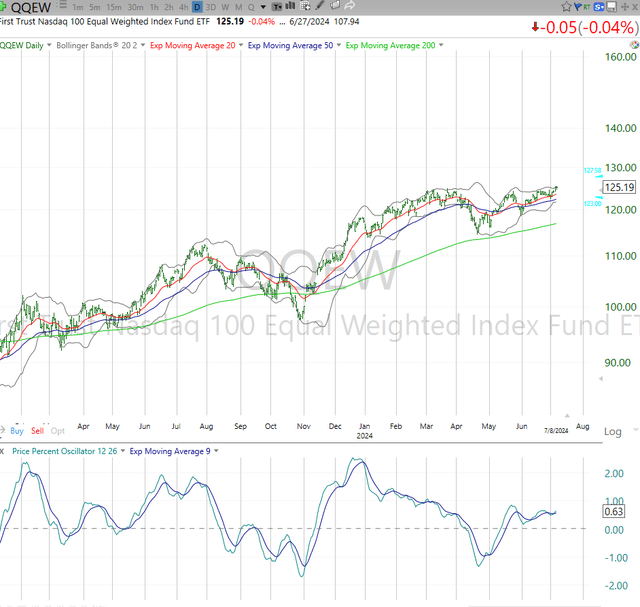
And the equal weighted ETF chart does not look too much different. That indicates to me that there could be a more fully engaged Nasdaq 100 if this continues higher.
Not a single aspect of this screams “buy and hold” to me. Not here, not now. So, what am I doing?
- “Renting” Nasdaq 100 melt up exposure via out of the money call options on both QQQ (the one with better options liquidity than the lower expense ratio ticker QQQM).
- Using a bit of leveraged QQQ exposure, but with the idea that these are more like “swing trades” than investments. I emphasize that because I do believe there continues to be upside in this part of the market, but the time left in the proverbial hourglass is getting tighter. And if not, then the call options can go parabolic, and I’ll be thrilled.
- What I am not doing is trying to “time” this by having heavy exposure to it. Taking a relatively small part of my total portfolio, and devoting it to more of a “make or break” QQQ-oriented exposure, is how I define my maximum loss. This is because with options, the buyer’s loss is limited to how much money they invest.
- I am even “flirting” with small but closely watched positions in ETFs that just focus on the biggest Nasdaq stocks. I’ll write on those soon, from a pure technical analysis standpoint.
None of this should be confused with “traditional” investing because after 3 years of mediocre returns for most stocks, I am not convinced this is a “buyer’s market.” And I am a risk manager first, second and third.
That all leads me to view anything Nasdaq-oriented with a high skeptical eye, as I look forward to a time when some hidden laggard holdings within QQQM will be set up to be true long-term buys. That should happen, but I’m not sitting around waiting for it to happen.
As I say in many of my articles here, modern markets are different. And I think investors either adapt and gain greater control over their own financial destiny, or buy and hope. I am of the former approach, clearly.

