AntonioSolano/iStock via Getty Images
Overview
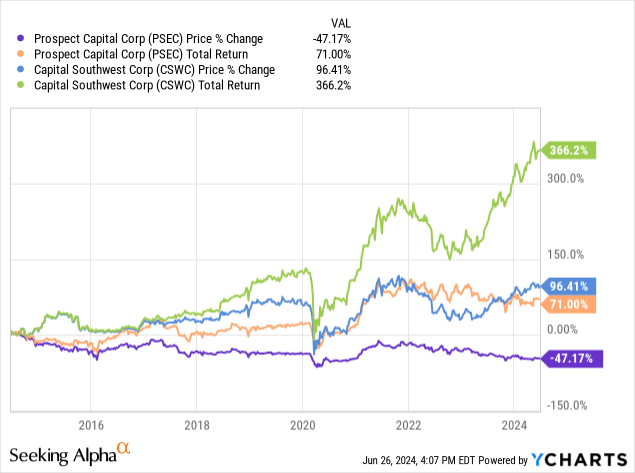
I previously covered Prosect Capital (NASDAQ:PSEC) back in March and downgraded my rating to a hold due to the BDC’s growing vulnerabilities surrounded the prolonged period of elevated interest rates. I wanted to revisit the business development company after its most recent earnings and reassess valuation based on the performance and growth of its net assets. I also wanted to provide some thoughts as I believe that the possibility of interest rate cuts are higher now. We can see that the price of PSEC has fallen by 47% over the last decade. However, the high distribution yield has helped offset this price deterioration and provides a total return of 71% over the same period.
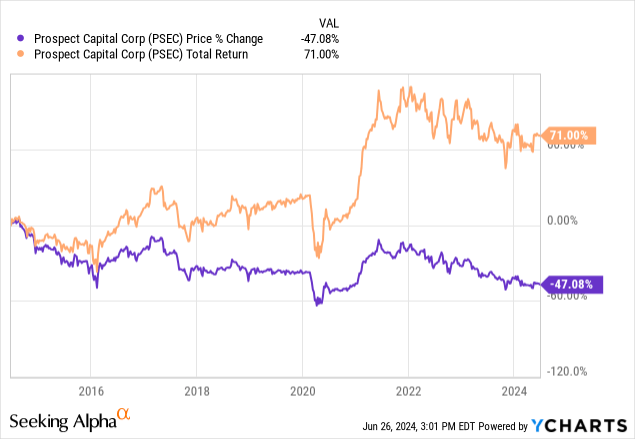
PSEC implements a monthly distribution which helps add to its appeal towards investors that are interesting in prioritizing income. The current dividend yield sits in the double digits at 12.8%. Since PSEC operates as a business development company, the price of it can vary from the actual net asset value of the fund. With that in mind, PSEC currently trades at a very large discount to its net asset value, which can be a good source of reference when determining whether or not its a good time for entry.
To provide some background, Prospect Capital is a business development company that generates their earnings through different forms of debt investment. The fund has been around since its inception in 2004 and has a market cap of about $2.3B. PSEC is externally managed by Prospect Capital Management but they bring over 30 years of experience to the fund. PSEC typically focuses on investing in middle market companies that have an EBITDA up to $150M since this area offers a lot of potential for borrowers to continue growing.
Portfolio Strategy & Risk Profile
The strategy of PSEC is to remain diverse across many different sectors and industries to mitigate any concentration risk to one specific area of operation. Their portfolio of debt investments total $7.9B in assets and include 122 different portfolio companies that are spread across 36 different industries. What makes PSEC unique is that it has a primary focus on real estate related businesses, accounting for 18.4% of its net assets. This is followed by a 10.6% exposure to health care providers and services as well as a 9.1% exposure to consumer finance businesses.
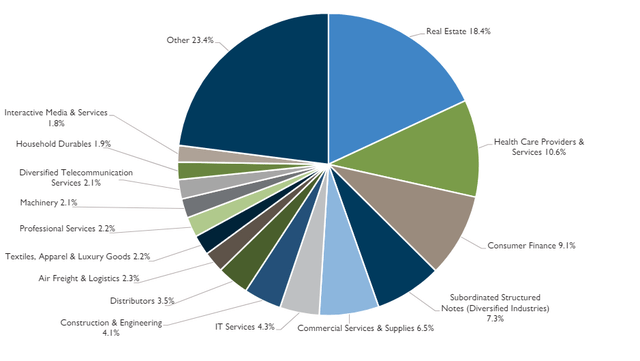
PSEC Q3 Presentation
This primary focus on real estate leaves a bit of a mixed outlook for me. On one end, I think real estate is a great market to operate in since it’s always in demand and has lots of growth potential. However, the sector has been heavily suppressed with the rise of interest rates. As interest rates rise, the demand for real estate on the retail and commercial level has slowed since the acquisition of property typically relies on debt financing. Since interest rates sit at their decade highs, this means that the desire to borrow money right now is much lower as it means that any debt borrowed costs more to maintain through higher interest payments. We can see the direct inverse correlation between the real estate sector (XLRE) and the federal funds rate.
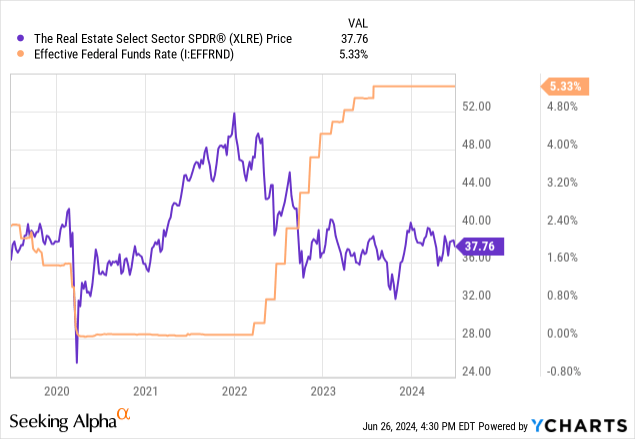
However, the fact that PSEC structures most of their investments following a senior secured strategy does offset a bit of this risk. Approximately 74% of their portfolio is made up of first lien senior secured debt and other secured debt. Senior secured debt sits at the top of the capital structure which means that it has the highest priority of repayment. This offers some protection against the invested capital in scenarios where a portfolio company is going through an bankruptcy and liquidating assets. This structure helps increase the likeliness that not all of the BDC’s money is lost because of a bad investment.
Additionally, over 80% of PSEC’s debt investments are made on a floating rate basis. This means that PSEC should have been able to capitalize on this higher interest rate environment because as interest rates rise, so does the required level of interest that their borrowers have to pay on the debt owed. While this can be great for earning higher levels of income, it can also present a vulnerability as it also means that borrowers may see increased strain on their business operations from the lower profit margins due to debt maintenance. It can be a balancing act that needs to be well-crafted through intensive underwriting.
We can measure the success of PSEC’s underwriting ability by observing their non-accrual rate. Non-accruals are companies that have reached delinquent status with their payments and full repayment of any debts are not expected. Non-accruals can happen when a company is severely underperforming earnings expectations and cannot keep up with the required debt payments. As of the latest reporting, PSEC’s non-accrual rate sits at 0.4% of fair value. This is great when compared against some other BDC non-accrual rates.
- Capital Southwest (CSWC): 2.3% non-accrual rate at fair value.
- Main Street Capital (MAIN): 0.5% non-accrual rate at fair value.
- Ares Capital (ARCC): 1.7% non-accrual rate at fair value.
Financials
PSEC reported their Q3 earnings last month and the results were stronger than expected. Most importantly, NII (net investment income) per share amounted to $0.23, which came in higher than analyst expectations of $0.20 per share. Despite the solid net investment income per share, I noticed that total originations have drastically dropped. Originations represents the total of new investments that a BDC makes so a drop in originations can directly translate to a drop in new revenue sources into the future. With originations dropping, PSEC will not be able to grow their net assets efficiently.
We can assume that a drop in originations has something to do with the majority exposure to the real estate sector and there are probably a lower volume of deals available. Total originations dropped down to $28.9M, a big difference from the $219.5M committed in the prior quarter. We can see that the majority of the new originations for the quarter is within the real estate sector, accounting for 43.1%.
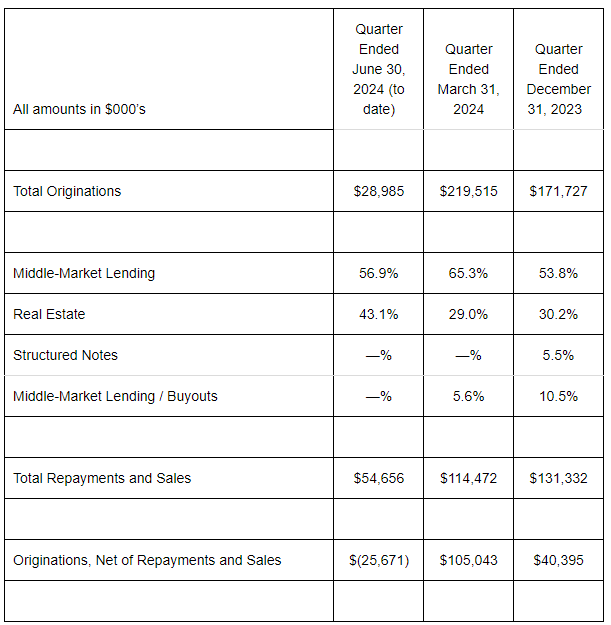
PSEC Earnings
Similarly, the amount of repayments and sales has been cut in half. Total repayments for the quarter landed at $54.6M, a large decrease from last quarters total of $114.4M. A slowing amount of repayments could be an indication of issues arising from the portfolio companies and be a sign of rising non-accruals in the future. Since non-accruals are still low though, I do not believe we have reason to worry yet. However, a lower amount of repayment leaves PSEC with less cash on hand that can be used to grow their portfolio or navigate through market fluctuations and headwinds.
In terms of liquidity PSEC sits with cash and equivalents totaling $48.9M. Their long term debt level currently sits at $2.4B but this isn’t a concern because of the way their debt maturity structure is scheduled. They have notes due in 2025 but this can be covered with a combination of cash on hand and available credit facility of over $2B.
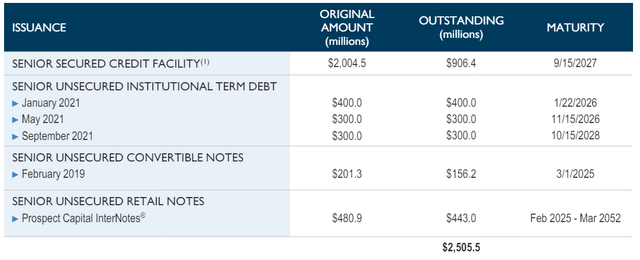
PSEC Presentation
Dividend & Income Comparison
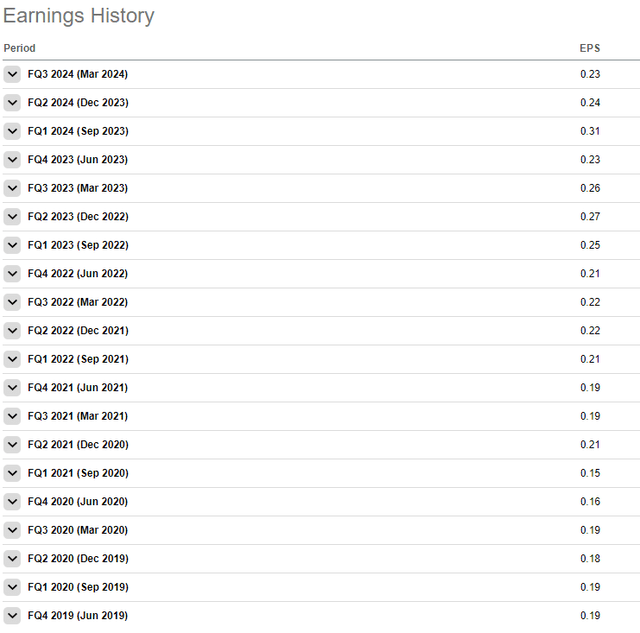
As of the most recently declared monthly dividend of $0.06 per share, the current dividend yield sits at 12.8%. As previously mentioned, NII per share landed at $0.23 for the quarter. If we translate the monthly dividend into quarterly terms, we’d get a quarterly distribution of $0.18 per share. This means that the current dividend is covered by about 128% which means that there is a comfortable cushion of safety for the distribution at the moment. However the dividend rate for PSEC has remained the same since 2017 which reveals this feat to be a lot less impressive.
In fact, taking a look at the earnings history of PSEC reveals that the BDC has failed to show any level of meaningful growth of their NII per share over the last five year period. While NII per share did grow briefly up to $0.31 per share in Q1 of 2024 due to the higher interest income received from floating rate investments, it has quickly come back down closer to its range closer to $0.19 to $0.23 per share.
Seeking Alpha
I point this out because this level of inconsistent growth is why shareholders of PSEC are not receiving any supplemental distributions or raises in base distributions the way that other BDCs are implementing. Perhaps this is related to the fact that PSEC is externally managed by Prospect Capital Management. If we were to compare the growth of the distribution against an internally managed BDC like Capital Southwest Corp (CSWC), the difference in performance here is clear. Internally managed BDCs do not have to dish out larger portions of earnings towards management fees which means that more of the earnings are likely to get passed along to shareholders in the form of supplementals and raises.
For instance, PSEC’s dividend has remained the same since 2017. However, Capital Southwest’s dividend has increased at a CAGR (compound annual growth rate) of 9.08% over the last five year period. As earnings and NII per share increased, so did the distributions that were passed onto shareholders. CSWC announced a supplemental distribution of $0.06 per share in May. This means that if you are looking for a stream of income that will grow at a faster rate during positive market conditions, PSEC is a weak choice.
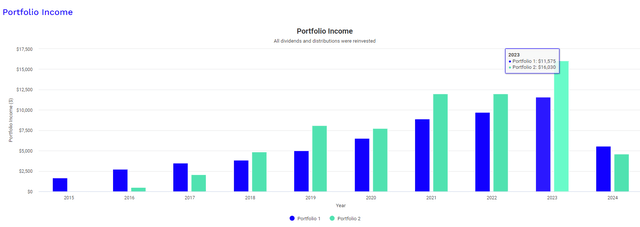
We can better visualize this comparison by running a back test on the dividend income provided by both PSEC and CSWC over the same time period. This graph represents an equal investment of $10,000 in 2015 in both PSEC and CSWC and assumes that a monthly contribution of $500 was added to the positions throughout the holding period. It also assumes that all dividends received were reinvested back into each respective BDC to accumulate more shares and compound the distribution. The dark blue bars represent PSEC and the mint green bars represent CSWC.
Portfolio Visualizer
In 2015 your dividend income would have been $1,673 for PSEC and a mere $31 for CSWC. Fast forward to the full year of 2023 and the income for PSEC would have grown to $11,575 while the income for CSWC would have outpaced the growth of PSEC and would now amount to $16,030. Even when comparing the total return profile of the two, we can see that the internally managed BDC outperforms over the last decade. The price return of CSWC is even greater than the total return, including distributions, of PSEC over the last decade which really helps put it in perspective.
Valuation
Since PSEC operates as a business development company, the price can vary from the fund’s actual NAV (net asset value). As a result, this gives us the chance to enter when the price trades at a discount to the NAV. However the story with PSEC is a bit different because if we look at the ten year history we can see that the price has consistently traded at a discount to NAV. PSEC currently trades at a massive discount to NAV of nearly 38%. This is a nearly identical discount that it traded at last time I covered PSEC. For reference, the price has traded at an average discount to NAV of only 28% over the last three years.
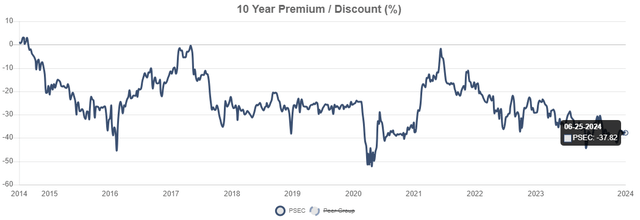
CEF Data
You may think that since the price trades at a larger discount to NAV than usual, that it may be a good time to start a position. However, the fact that the NAV has failed to grow in prime interest rate conditions reveals some underlying flaws. These heightened interest rates should have brought in higher levels of profitability and cash flow that could then translate to meaningful NAV and price growth.
We can see that the price has failed to capture and maintain any meaningful growth over the last five year period. A stagnant NAV can be the result of the distribution eating away at the majority of earnings, high operational costs which includes management fees, credit losses within the portfolio, or a combination of all. I pulled some peer BDCs at random and we can see that PSEC is the only one with a negative price growth over the last five years.
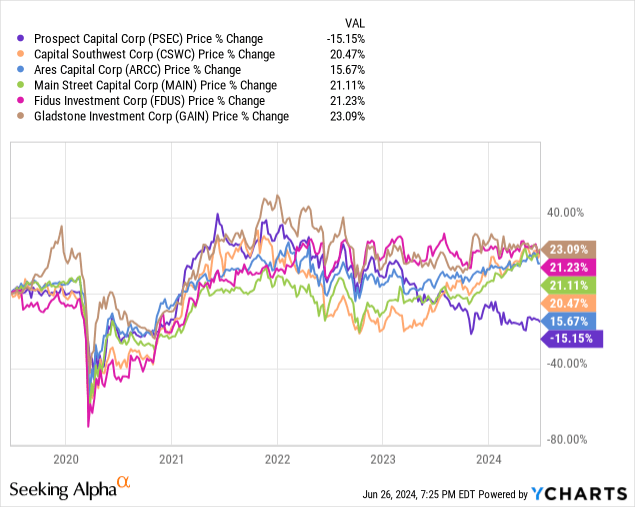
As a result, I maintain my hold rating on PSEC. The only reason I am remaining at a hold rating is because the distribution is still covered with enough of a margin that alleviates any worries of a cut. Despite the lack of dividend raises or supplementals, PSEC’s ability to maintain the same distribution rate can still be valuable for an investor looking to create a monthly income stream from their portfolio. However, I would not expect any price growth from PSEC at the moment. Since the majority of the fund is exposed to real estate, I plan to revisit to see what the price performance looks like as I believe that interest rate cuts has the potential to be a positive catalyst for PSEC’s price movement.
Takeaway
In conclusion, PSEC is a diverse BDC with a ride range of industry and sector exposure. The price history is lackluster but the consistent distributions help deliver a positive total return. Despite the lack of dividend increase or supplementals, the monthly dividend consistency may still offer value and investors are capable of creating their own compounding effect through continued investment. However, when compared against BDC peers, especially the internally managed ones like CSWC, I believe there to be higher quality BDCs out there to choose from.

