Jonathan Kitchen
In early July, REITs started to materially outperform the broader market with 1402 basis points of outperformance for the Dow Jones Equity REIT index over the S&P since July 9.
S&P Global Market Intelligence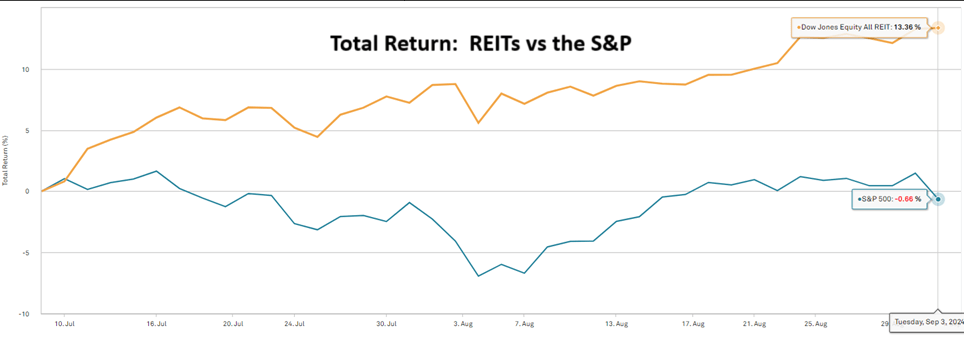
Given the divergence, it behooves REIT investors to check valuation and make sure REITs haven’t gotten ahead of themselves.
This article will discuss the relative valuation of REITs compared to the S&P.
Methodology
REIT index multiples as published by data providers are means or medians of the constituents.
S&P index multiples as published by data providers are the harmonic average consisting of bottom-up earnings estimates of the constituents. Thus, to get an apples-to-apples comparison, we should apply the same harmonic average to REITs.
Factset reports the S&P forward multiple as 21.0:
“Earnings Guidance: For Q3 2024, 48 S&P 500 companies have issued negative EPS guidance and 41 S&P 500 companies have issued positive EPS guidance. • Valuation: The forward 12-month P/E ratio for the S&P 500 is 21.0. This P/E ratio is above the 5-year average (19.4) and above the 10-year average (17.9).”
This is the price of the S&P divided by the summed earnings estimates of the individual S&P constituents as shown below.
FactSet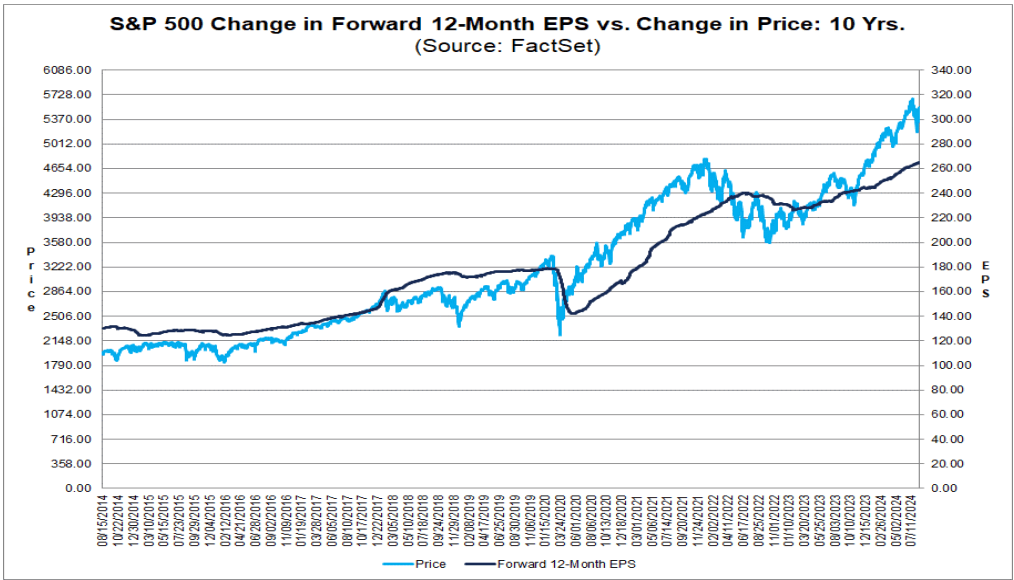
I believe this to be the correct methodology for calculating the multiple of an index.
REITs get far less coverage by the community of analysts and the reported multiple of REIT indexes is more simplistic. The Dow Jones Equity REIT index is trading at 19.79X forward FFO.
S&P Global Market Intelligence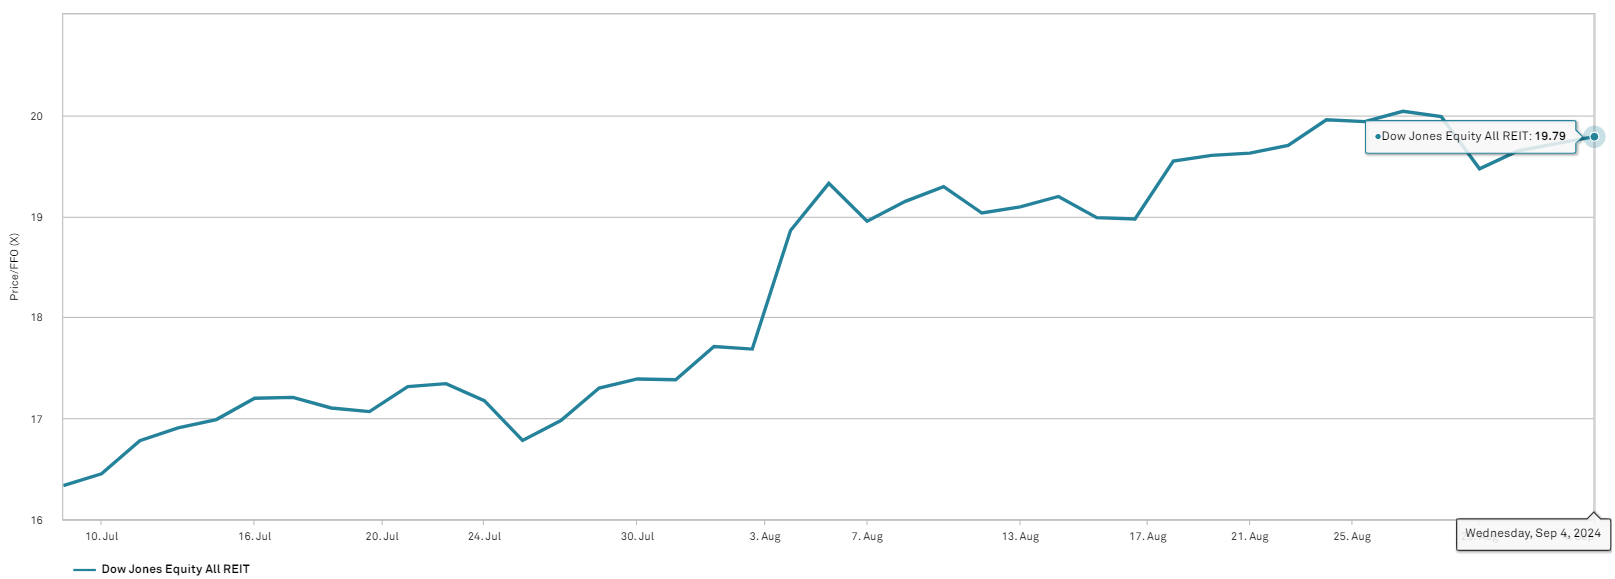
This number, however, is not a harmonic average like the reported multiple on the S&P. It’s the market cap weighted mean of the price to FFO of the constituents of the REIT index.
To make a cleaner comparison, we should make two adjustments:
- Use AFFO instead of FFO as it is generally a better metric of REIT cash flows.
- Use bottom-up earnings and then divide the summed AFFO of the constituents by the summed market cap.
Here’s the index level data without harmonic average. All data is for an estimated 2024 AFFO.
- Mean P/AFFO – 17.3.
- Median P/AFFO – 16.4.
- Market cap weighted P/AFFO – 21.77.
Among REITs, there’s often a skew with large market caps trading at higher multiples. That’s particularly pronounced right now with the market cap-weighted index trading more than five turns more expensive than the median REIT.
Now we should convert these numbers to the same bottom-up methodology used for the reported S&P multiple.
The summed AFFO of equity REITs with consensus 2024 AFFO reported by S&P Global Market Intelligence is $63.514 billion. The aggregate market cap of these same REITs is $1.262 trillion.
Thus, the bottom-up AFFO multiple for a market cap weighted REIT index is 19.87X. An equal-weight REIT index is substantially cheaper with a harmonic average AFFO multiple of 14.76X.
That would imply REITs are still a bit cheaper than the S&P.
- S&P earnings yield = 4.76%.
- REIT market cap weighted AFFO yield = 5.03%.
- REIT equal weighted AFFO yield = 6.77%.
Here’s the base data and calculations
2MC with data from company filings and S&P Global 2MC with data from company filings and S&P Global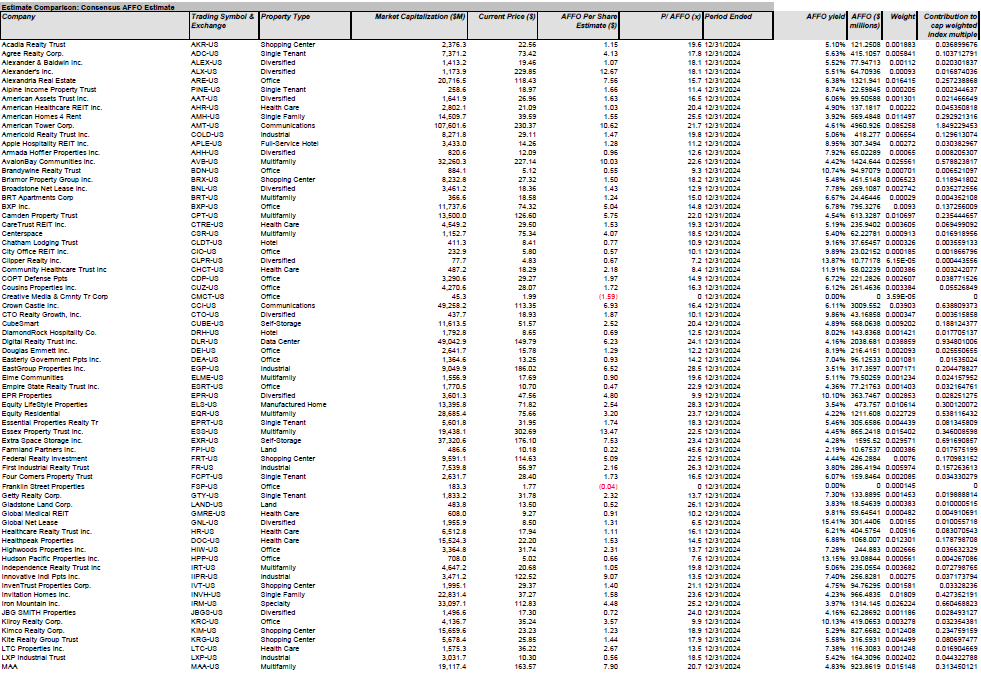
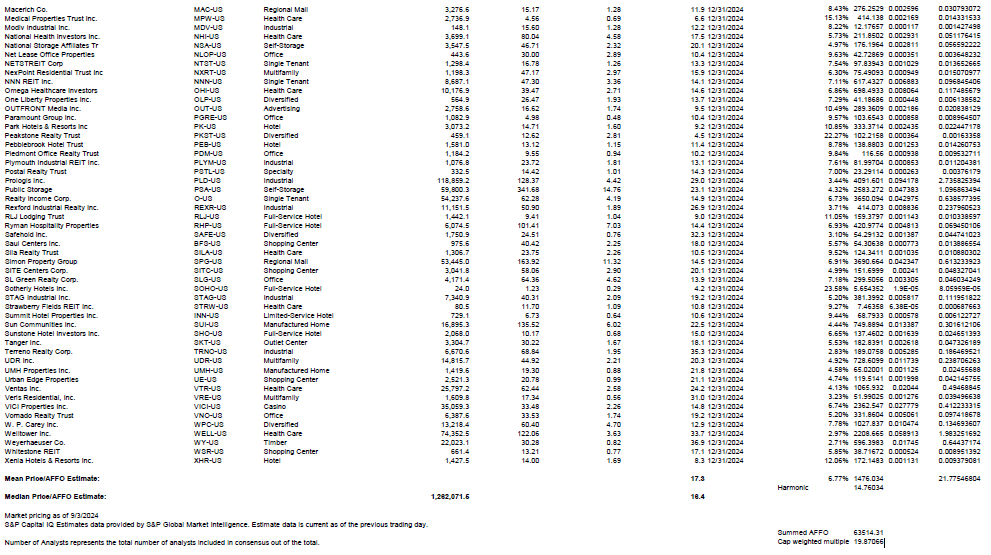
For your viewing convenience, here’s a larger font size version.
REIT_harmonic_multiple_calculations.pdf
Valuation with fundamentals in perspective
Cheaper does not always mean better, but in this case, I think REITs are better positioned due to the combination of value and growth. Here are the revenue growth expectations for each of the 11 S&P sectors.
FactSet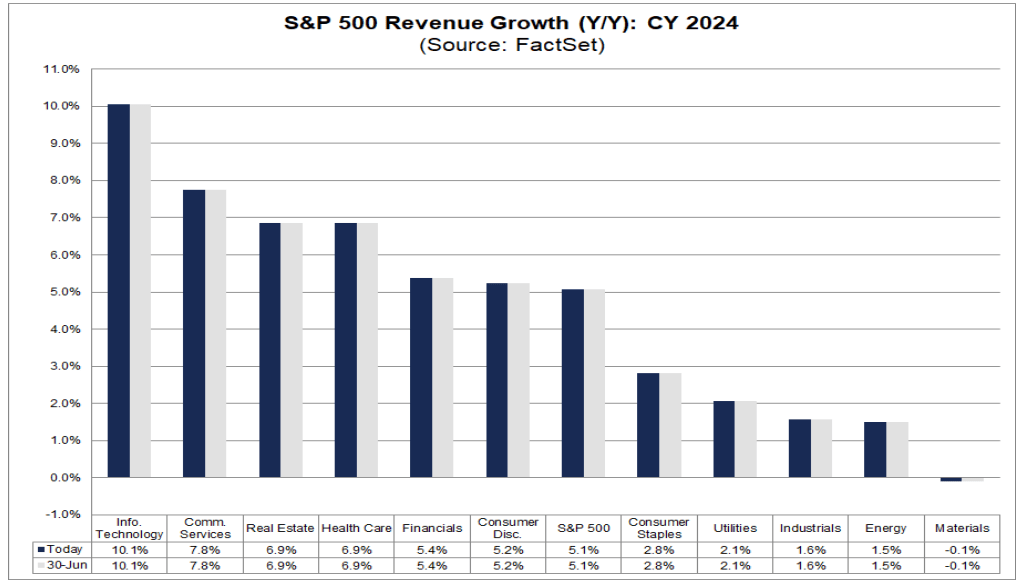
REITs have the third-highest revenue growth at 6.9% for calendar year 2024. Note that the higher revenue growth sectors tend to trade at premiums.
- Information Technology trades at 36.7X trailing earnings.
- Communications services trades at 27.8X.
REITs, despite being the third-highest in revenue growth, trade at 19.87X market cap weighted or 14.76X equal weighted.
It’s also worth noting that REITs have substantially higher profit margins so revenue growth flows nicely to the bottom line.
REITs average right around 40% bottom line margins.
S&P Global Market Intelligence
In comparison, the S&P has about 11.5% profit margins.
FactSet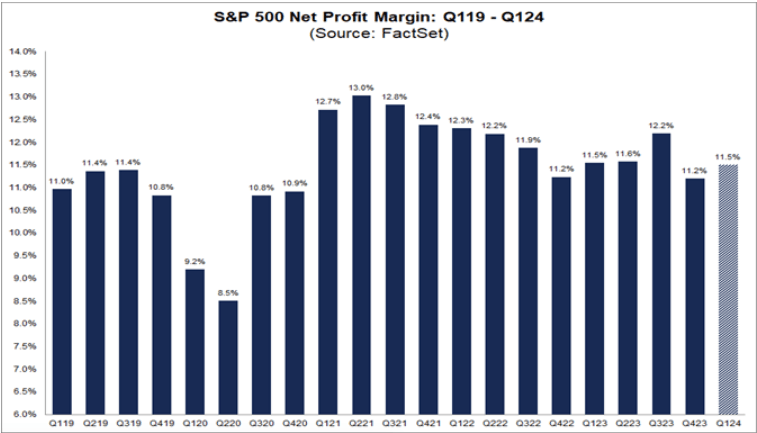
At a broad level, these metrics lead me to believe that going forward REITs are positioned to outperform the S&P.
One could obtain exposure through an ETF like the Vanguard Real Estate Index Fund ETF Shares (VNQ), but any broad ETF is going to contain the bad along with the good.
In REITs, there’s quite a bit of mispricing which provides an astute investor with the opportunity to avoid the overvalued and the fundamentally weak while also picking up discounted strength. The best way to do this is by studying each individual company, but here are some quick thoughts.
- Self-storage is both fundamentally weak and overvalued.
- Triple net is broadly undervalued with low AFFO multiples, particularly given an impending rate-cutting cycle.
- The office is fundamentally weak.
- Canadian-domiciled REITs with U.S. properties trade at substantial discounts to asset value.
- Shopping center growth is underestimated by market pricing.
- Industrial REITs have a wide spread in AFFO multiples despite similar growth trajectories.
Opportunities abound. Happy hunting.

