ewg3D/iStock via Getty Images
Introduction
The Schwab U.S. Dividend Equity ETF (SCHD) is a popular ETF that tracks the total return of the Dow Jones U.S. Dividend 100™ Index. The index measures the stock performance of 100 high dividend paying U.S. companies selected based on their fundamental strength and the sustainability of their dividends. The ETF can form the core of a passive income portfolio or the basis for which to further screen for potential securities to include in a diversified portfolio.
We like to use the ETF as a starting point for our research and then review the component stock’s P/E ratios as compared to the justified P/E ratios. The P/E ratio is not explicitly accounted for in the inclusion process for the index and so giving the ratio some weight may enhance the security selection process. In particular, we look at P/E ratio in relation to the justified P/E ratio which we shall describe further.
Methodology Overview
The P/E ratio is the most used valuation metric among equity investors. For the forward P/E, the ratio provides a quick measure of how much value the market is assigning every dollar of expected earnings for the security in the next twelve months. As investors, we each have a claim on the future earnings of the business we invest in and the ratio gives us a gauge on what the current value is of those expected earnings.
Less utilized is the “justified P/E” ratio. Whereas the forward P/E ratio uses an external price to value the earnings of a company, the justified P/E ratio doesn’t use an external price in the numerator. Instead, the justified P/E ratio is a ratio that is derived based on the fundamentals of the company. It is “justified” by the fundamentals.
The justified P/E is rooted in valuation theory and in order to communicate clearly its utility and explain what is and isn’t contemplated by the ratio, I will introduce two formulas. Readers may wish to skip to the subsequent section which contains the meat of the article.
Methodology Detail
At a basic level, investing is an exchange of cash flows. We exchange cash flows today for cash flows that we can earn in the future. Conceptually, when we are investing, we are concerned with three items: the amount of cash flows we are getting, the growth rate of the cash flows in the future and the riskiness of the cash flows. This is represented by the Gordon growth model:
Investopedia
Simply, the price (P) of a security is determined by three items: upcoming dividends (D1) and the cost of equity (r) and the growth rate (g). The dividends represent the cash flows we are getting, the cost of equity is an estimate that incorporates the risk profile of the security and the growth rate is self-explanatory.
If you were to divide both sides of the equation by estimated earnings for the next twelve months, (E1), we arrive at the justified P/E ratio.
Author’s interpretation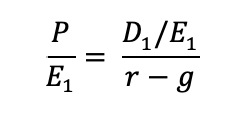
This formula demonstrates that the P/E ratio is a function of dividends divided by earnings (D1/E1 or the payout ratio) and the cost of equity (r) and the growth rate (g). These are the three items that we directly consider with the justified P/E ratio. Should there be a deviation with the forward P/E, it could indicate potential over or under valuation.
While the formula is straightforward, there is a significant amount of subjectivity involved. For example, what time frame for the growth rate would you use? Or, how would you measure the cost of equity (r)? In this article, we use the capital asset pricing model (CAPM) to measure the cost of equity. With CAPM, we incorporate the volatility of the stock as measured by the beta statistic (β), the macroeconomic environment as measured by a risk-free rate, and an equity risk premium which is the premium investors expect over the risk-free rate for investing in stocks. For growth, we use the 10-year compound annual growth rate in normalized earnings as provided by Seeking Alpha.
Source: Equity Asset Valuation, Second Edition, by Jerald E. Pinto, CFA, Elaine Henry, CFA, Thomas R. Robinson, CFA, and John D. Stowe, CFA, Copyright 2009, CFA Institute. The beta statistic used is the 60-month beta as published by Seeking Alpha. The payout ratios used is also from Seeking Alpha. We use the U.S. 10-year Treasury as published by CNBC on September 7th 2024 as a proxy for the risk-free rate and the equity risk premium is published by Aswath Damodaran at NYU.
Let us know turn to the particular stocks in this review.
Overvalued
UPS
Author’s calculation, Seeking Alpha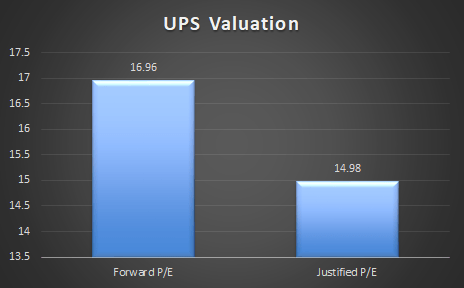
Small package giant United Parcel Service, Inc. (UPS) currently trades at a forward P/E of 16.96. This is 13.19% above where the P/E ratio should be according to our estimate of the justified P/E ratio. UPS has a payout ratio of 89.53% and their 10-year normalized net income growth rate is 1.71%. The high payout ratio has earned it a B- for dividend safety. With respect to longer-term growth, favorable tailwinds from e-commerce should continue to buoy the business. However, this is partly offset by Amazon’s ongoing effort to internalize last-mile delivery. We also expect continued margin pressure due to compensation cost increases as part of the renegotiated national master agreement with the Teamsters. In terms of risk, UPS has a beta statistic of 0.98 which indicates that the stock moves almost in lock step with the market which has a beta statistic of 1.0.
Source: UPS 10-K for 2023, Morningstar, CFRA, Valueline
KMB
Author’s calculation, Seeking Alpha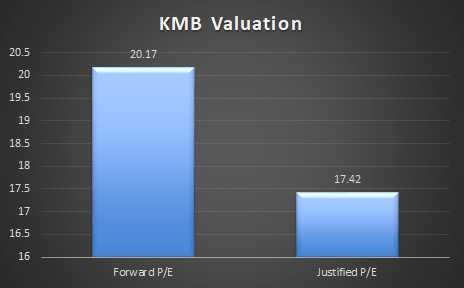
Kimberly-Clark Corporation (KMB) is a consumer tissue and personal care leader and has a meaningful market share with several of their brands. KMB has a diversified revenue stream with 46% of revenues coming from outside the North America. The steady demand for their products has translated into a beta statistic of 0.40. For every step move of the market, KMB’s stock moves less than half a step. This stability is also evident with their 51-year dividend growth record. They payout 66.48% of every dollar earned in dividends. Even with the market share and brand recognition, KMB does not have the ability to pass on meaningful price increases because of low switching costs at the grocery shelf. In times of economic stress, consumers could trade down to lower-priced, non-branded items. KMB’s normalized net income growth for the last 10 years is 1.52%.
Source: KMB 10-K for 2023, Morningstar, CFRA, Valueline
Fairly Valued
PKG
Author’s calculation, Seeking Alpha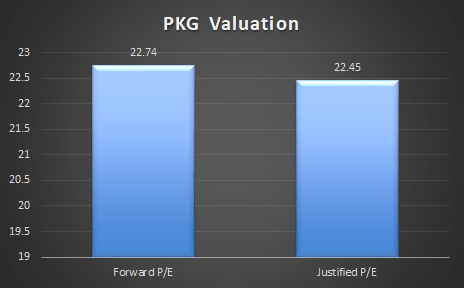
Packaging Corporation of America (PKG) is one of the largest producers of corrugated packaging in North America. E-commerce is a tailwind for this business as many industrial and consumer items are shipped using corrugated packaging because of its low cost and durability. Nonetheless, PKG’s business is impacted by demand factors in their end user markets. Food, beverages, and agricultural products make up 42% of the end user markets and retail and wholesale make up 28% of the end user markets.
PKG has a beta statistic of 0.79 which suggests it is less volatile than the market but still strongly correlated to the overall economy. Even with their scale, PKG profit growth is constrained because small paper producers can switch their manufacturing assets to containerboard production and enter the market without much difficulty. PKG retains about 38 cents for every dollar earned and has delivered a 10-year normalized net income growth of 4.17%.
Source: PKG 10-K for 2023, Fibre Box Association, Morningstar, CFRA, Valueline
Undervalued
PEP
Author’s calculation, Seeking Alpha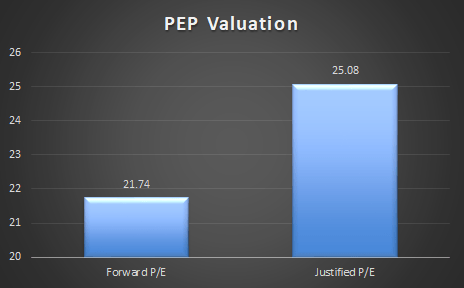
PepsiCo Inc. (PEP), the beverage and snack behemoth, has a strong portfolio of brands that has proven resilient through economic cycles. They have a track record of being able to pass on price increases when they have to. The beta statistic 0.54 reflects their stable revenue stream, strong cash flows and leading global market positions. Like KMB, PepsiCo is a dividend king with 51 consecutive years of growing dividends under their belt. PEP pays out about 65 cents for every dollar earned and can plausibly maintain their 10-year normalized growth record of 3.31% well into the future. Their growth strategy includes innovation in in the non-carbonated soft drinks segment. Growth in international markets is also expected to be a material tailwind for the business.
Source: PEP 10-K for 2023, Morningstar, CFRA, Valueline
Risks and Limitations
In this article, we used a justified P/E ratio to infer whether a stock is over, under, or fairly valued. The justified P/E ratio only contemplates the payout ratio, the cost of equity and the growth rate. The cost of equity measure employed looks at the stocks volatility, the current risk-free rate and the equity risk premium. Other factors that may be important are not included. Moreover, each factor is subjectively measured which impacts the result.
Investor Takeaway
For investors looking to enhance their return profile, a rebalance of their portfolio away from KMB and UPS and towards PEP may be a worthwhile endeavor. Furthermore, the justified P/E ratio has the advantage over the forward P/E ratio in that it includes the current macro setting because it incorporates a the risk-free rate through the cost of equity estimate. Taking an average forward P/E over the course of, say, ten years doesn’t speak to the macro environment in each of those years.

