Just_Super/iStock via Getty Images
Performance Summary
|
Cumulative |
Annualized |
|||||
|
3 Month |
YTD |
1 Year |
3 Year |
5 Year |
10 Year/ LOF 1 |
|
|
Fidelity Asset Manager 60% (MUTF:FSANX) Gross Expense Ratio: 0.66% 2 |
1.18% |
5.95% |
11.82% |
1.80% |
7.22% |
6.31% |
|
4.28% |
15.29% |
24.56% |
10.01% |
15.05% |
12.86% |
|
|
Fidelity Asset Manager 60% Composite Index |
1.52% |
6.09% |
12.22% |
2.42% |
6.98% |
6.51% |
|
Morningstar Fund Moderate Allocation |
1.18% |
6.56% |
12.61% |
2.83% |
7.05% |
6.20% |
|
% Rank in Morningstar Category (1% = Best) |
— |
— |
57% |
68% |
46% |
44% |
|
# of Funds in Morningstar Category |
— |
— |
740 |
689 |
649 |
493 |
|
1 Life of Fund (LOF) if performance is less than 10 years. Fund inception date: 10/09/2007. 2 This expense ratio is from the most recent prospectus and generally is based on amounts incurred during the most recent fiscal year, or estimated amounts for the current fiscal year in the case of a newly launched fund. It does not include any fee waivers or reimbursements, which would be reflected in the fund’s net expense ratio. Past performance is no guarantee of future results. Investment return and principal value of an investment will fluctuate; therefore, you may have a gain or loss when you sell your shares. Current performance may be higher or lower than the performance stated. Performance shown is that of the fund’s Retail Class shares (if multiclass). You may own another share class of the fund with a different expense structure and, thus, have different returns. To learn more or to obtain the most recent month-end or other share-class performance, visit Fidelity Funds | Mutual Funds from Fidelity Investments, Financial Professionals | Fidelity Institutional, or Fidelity NetBenefits | Employee Benefits. Total returns are historical and include change in share value and reinvestment of dividends and capital gains, if any. Cumulative total returns are reported as of the period indicated. For definitions and other important information, please see the Definitions and Important Information section of this Fund Review. Not FDIC Insured • May Lose Value • No Bank Guarantee |
Market Review
Continued global economic expansion and a slowing in the pace of inflation contributed to a largely favorable backdrop for risk assets in the second quarter of 2024. U.S. large-cap stocks led the way, followed by emerging markets and commodities. Many asset classes advanced in a fairly quiet three months, as an expected move toward monetary easing in some markets inched forward.
Looking ahead, however, the pace and magnitude of global monetary easing remains largely uncertain, while near-term risk of a recession in the U.S. appears muted.
Against this dynamic backdrop, domestic stocks gained 3.24% for the quarter, according to the Dow Jones U.S. Total Stock Market Index (DWCPF). Only three of 11 sectors outperformed the index: information technology (+12%), communication services (+9%) and utilities (+5%). Conversely, materials (-5%) trailed by the widest margin, followed by industrials (-3%) energy and financials (-2% each).
U.S. large-cap stocks notably topped small- and mid-caps for the quarter. From a style perspective, growth stocks outperformed value. Commodities, as measured by the Bloomberg Commodity Index Total Return, gained 2.89%.
Looking abroad, international equities advanced 1.04% for the second quarter, as measured by the MSCI ACWI (All Country World Index) ex USA Index. Performance among regions within the index was mixed. Emerging markets (+5%) fared best, followed by the U.K. (+4%) and Asia Pacific ex Japan (+2%). In contrast, Japan (-4%) and Canada (-2%) underperformed the broader market.
In fixed income, U.S. taxable investment-grade bonds, as measured by the Bloomberg U.S. Aggregate Bond Index, gained 0.07% amid mixed economic data and an ongoing holding pattern on benchmark interest rates by the U.S. Federal Reserve. Top-tier, AAA- rated investment-grade securities (+0.53%) fared best by a notable margin. Results were mixed among yield-advantaged, credit- sensitive sectors. U.S. investment-grade corporate bonds (-0.09%) and agency mortgage-backed securities (+0.07%) trailed U.S. Treasurys (+0.10%) and government-related securities (+0.30%), while asset-backed securities (+0.98%) and commercial mortgage- backed securities (+0.68%) solidly outperformed. Outside the Aggregate index, U.S. Treasury Inflation-Protected Securities advanced 0.79%, per Bloomberg, while U.S. high-yield corporates (+1.09%), leverage loans (+1.94%) and emerging-markets debt (+0. 44%) showed relative strength.
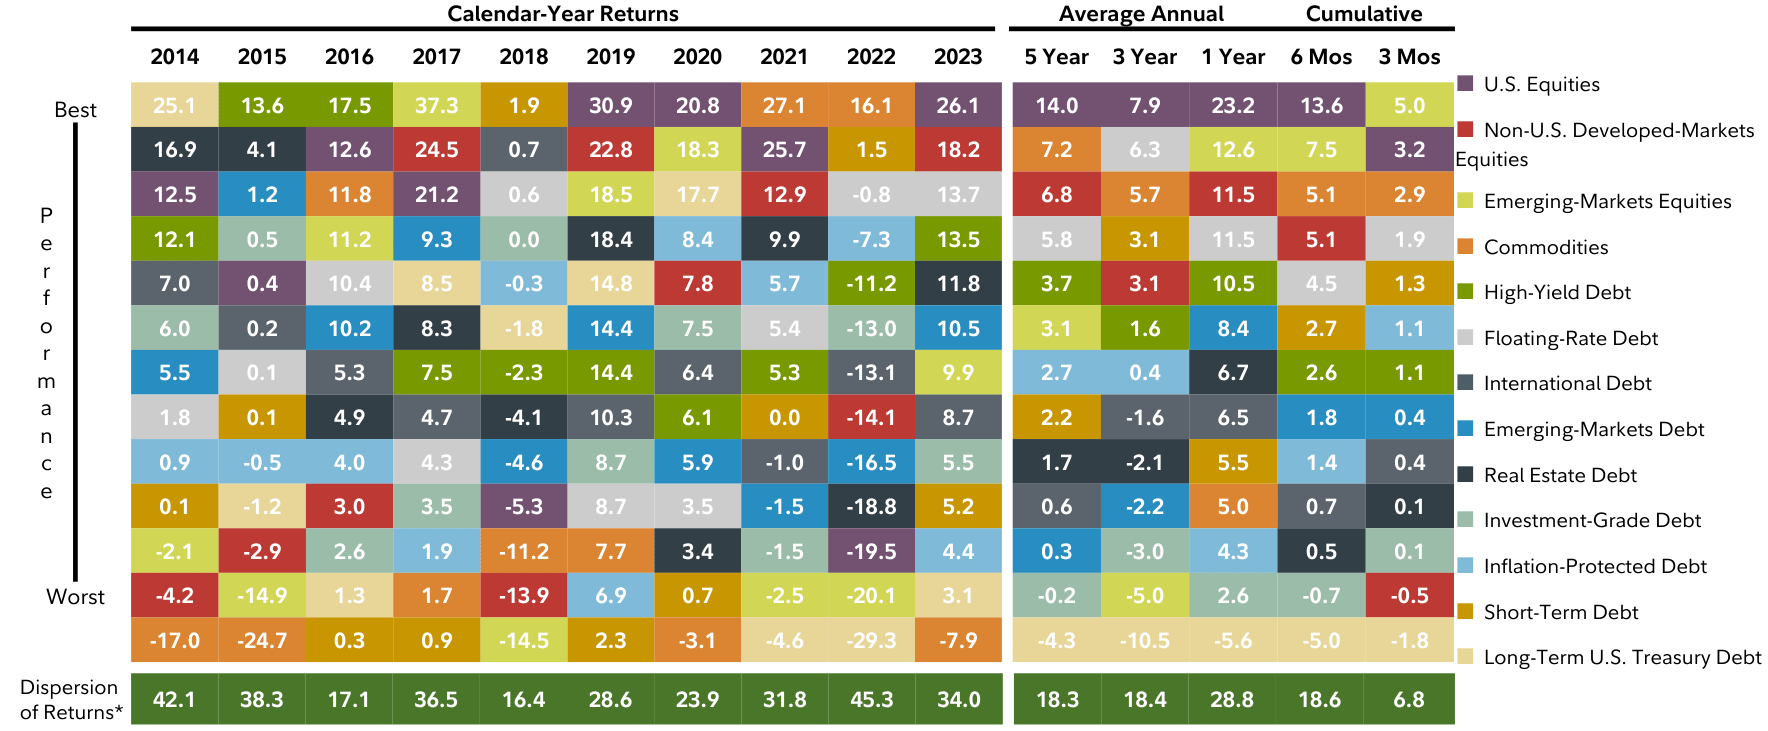
Broad Asset Class Returns (%) Period Ending June 30, 2024
|
Periods greater than one year are annualized. Source: FMR *Difference between best- and worst-performing asset classes over the given time period You cannot invest directly in an index. Past performance is no guarantee of future results. U.S. Equities – Dow Jones U.S. Total Stock Market Index, Non-U.S. Developed-Markets Equities – MSCI World ex USA Net Mass, Emerging-Markets Equities – MSCI Emerging Markets Index, Commodities – Bloomberg Commodity Index Total Return, High-Yield Debt – ICE BofA U.S. High Yield Constrained Index, Floating-Rate Debt – S&P/LSTA Leveraged Performing Loan Index, International Debt – Bloomberg Global Aggregate Credit Ex U.S. Index Hedged (USD), Emerging-Markets Debt – J.P. Morgan Emerging Markets Bond Index Global, Real Estate Debt – Fidelity Real Estate Income Composite Index, Investment-Grade Debt – Bloomberg U.S. Aggregate Bond Index, Inflation-Protected Debt – Bloomberg U.S. 1-10 Year Treasury Inflation-Protected Securities (OTCPK:TIPS) Index (Series- L), Short-Term Debt – Bloomberg U.S. 3 Month Treasury Bellwether Index, Long-Term U.S. Treasury Debt – Bloomberg U.S. Long Treasury Index |
Performance Review: Detailed Fund Attribution Relative to Benchmark
Strategy: Asset Allocation
Domestic and International Equities
- The Fund’s core equity allocation strategy – comprised of an overweight stake in the U.S., along with equal- weighted exposure to developed international and emerging markets – aided performance in the second quarter versus the Composite index, primarily due to favorable positioning in the U.S. (Positive)
- U.S. large-cap growth stocks once again topped the leaderboard this period, further adding to strong year-to- date gains in what was otherwise a relatively quiet Q2 for capital markets. Emerging-markets equities fared the best and outpaced their developed-market counterparts by a sizable margin.
- Elsewhere, the Fund’s non-Composite positioning in commodities and tactical investment in REITs did not have a material impact on performance the past three months. (Neutral)
Fixed Income
- The Fund’s fixed-income strategy modestly contributed to relative performance in the second quarter. Specifically, this positioning entailed comparatively light exposure to cash and investment-grade bonds, in favor of out-of-Composite allocations to Treasury Inflation- Protected Securities, bank loans, high-yield and EM debt, long-term U.S. Treasury’s and international corporate credit. (Positive)
- IG bonds posted a flat return amid a modest uptick in interest rates, lagging riskier segments of the credit market, including bank loans, high-yield and EM debt.
Strategy: Security Selection
Domestic Equities
- Security selection among U.S. stocks hampered relative performance the past three months.(Negative)
- Picks in the information technology sector, particularly among software & services companies, detracted the most. On the plus side, investment choices in communications services added modest value.
International Equities
- Security selection in international markets was another plus in the second quarter, primarily led by DM stocks.(Positive)
- Within DM, picks in Japan and to a lesser extent, Canada, helped the most.
- Conversely, adverse overall positioning in France and Switzerland were the biggest relative detractors.
- Turning to the Fund’s EM equity investments, favorable stock selection in South Korea, Singapore and Taiwan stood out to the upside, whereas positioning in Brazil proved to be a challenge.
- Foreign currency positioning aided the performance of both portfolios’ U.S.-based returns, although the contribution from EM was greater, as the dollar strengthened during the quarter.
Fixed Income
- Investment-grade bond picks bolstered the Fund’s relative return in Q2.(Positive)
- Corporate bonds issued by banks, insurers and consumer staples companies were beneficial to performance. Investment choices among asset-backed securities also helped. As it relates to government debt, U.S. Treasury’s and government-agency mortgage- backed securities (‘MBS’) contributed as well.
Outlook and Positioning
Several major economies throughout the world demonstrated persistent expansion in the second quarter, amid improved global financial conditions and firmer manufacturing activity. The U.S. and a number of other large developing economies – notably India, Mexico and Brazil – reflected an increase in in mid-cycle dynamics this period, while the U.S. still displayed significant late-cycle characteristics. Elsewhere, Japan and Europe remained solidly in late-cycle, whereas Canada showed increasing signs of recessionary risk and China continued to struggle to emerge from its growth slump.
After declining significantly from its 2022’s highs, the Consumer Price Index – both headline and core – remained above 3% in 2024. The Fed’s preferred inflation metric, the personal consumption expenditures index, registered lower price gains compared with other measures of inflation, however our forecasts for both CPI and PCE continue to indicate a flattish inflationary trend over the next year, rather than the disinflationary path currently reflected in market expectations. Moreover, we believe returning to the stable, low core-inflation backdrop of the past 20 years will be challenging.
As is typical during a late cycle expansion, the yield curve remains inverted. Our preferred yield curve – the 10-year less 3-month U.S. Treasury yield – has historically been a reliable leading indicator of recessions but has been inverted longer than almost all prior cycles. Several facets of the economy are well-positioned relative to history, including low housing supply, manageable household and corporate debt levels, a well-capitalized banking system, along with healthier consumer balance sheets.
After contracting modestly in 2023, investors expect a double-digit rebound for corporate earnings growth in 2024 and beyond.
Buybacks remain a tool to boost aggregate earnings per share but have been highly concentrated. The largest 20 companies accounted for half of all buybacks this year. After dropping from record-high levels, corporate profit margins have stabilized. Market participants anticipate that margins should remain elevated, but the ability of businesses to maintain pricing power will be key to this outlook.
Turning to positioning, as of midyear the Fund was overweight U.S. stocks, while moderately underweight international DM and neutral to slightly overweight EM. Given our generally positive view of risk assets in Q2, the portfolio’s outsized exposure to the U.S. includes modest positions in the smaller-cap focused iShares® Russell 2000 ETF and Fidelity® Enhanced Mid Cap Fund. We also maintained moderate stakes in the defensively oriented Fidelity® Hedged Equity Fund and comparable Fidelity ETF.
Total equity exposure included allocations of about 0.5% each to commodities and REITs. Given the current global geopolitical backdrop, we believe the Fund’s stake in the former may provide a hedge against flare-ups overseas.
On June 30, the portfolio’s allocation to investment-grade bonds was below its target weighting, which is where we intend to keep it for now. We also plan to maintain modest stakes in both long-term U.S. Treasury’s and TIPS. Positioning in the former increases the Fund’s interest-rate sensitivity and can also provide a buffer against equity market volatility. TIPS on the other hand, give the portfolio a low-cost hedge against rising inflation. We anticipate remaining invested in credit-sensitive bonds as well, given that their relatively higher yields should continue to prove beneficial.
At the midpoint of 2024, the Fund’s cash allocation was about 2%, below its 5% target weighting in the Composite index. While we continue to look for attractive opportunities to invest cash, we also recognize that it plays an important role as a defensive asset in times of market uncertainty. Moreover, doing so gives the portfolio a higher yield with no interest rate risk.

