honglouwawa
Thesis
Since the GFC, we’ve entered a secular age of money printing, defined by 3 to 5 year liquidity cycles that exert a strong gravitational pull on asset prices.
In this article, I will go over a case study of the 2019 to 2022 liquidity cycle, where I show the performance of the top ten constituents of the S&P 500, with regard to price appreciation, was a function of their weighted position at the start of the liquidity cycle, more so than their relative valuations at that point.
This phenomenon may indicate global liquidity’s influence on asset prices. Top weighted constituents, by the nature of their weightings, are in a better position to benefit from fund inflows, or more simply, currency debasement, during liquidity bull runs.
Further because it takes a good 10 years for valuations, and fundamental performance, to be reflected in a stock’s price action, over 90% of the time, these 3-5 year liquidity cycles tend to have an advantage, with regard to influence of price performance, as a function of their shorter time spans.
Based on this phenomenon, those companies that were sitting at the top of the S&P 500 at the start of the 2023 to 2026 global liquidity cycle will likely outperform by the end of its bull run, which will likely occur somewhere in mid to late 2025.
I also believe that the rotation to small caps, expressly at the expense of mega-cap tech, is a narrative that should be faded at the investment horizon of the 3-5 year liquidity cycle.
Background – The Global Liquidity Cycle
I recently went over the basics of the global liquidity cycle in my article SPY: Higher Multiples Are Justified. I encourage readers to look over the “debt monetization” section of that article to grasp that foundation on which my latest investment theses are built.
The brief summary is that major world countries have been in high levels of both public and private debt, since at least the beginning of the GFC; more debt than their GDP growth can alone service. So to avoid secular deflation, secondary to this unserviceable debt, the central banks monetize the public side of such through money printing.
Lately, the US Treasury has also been getting in on the action by distorting the ratio of issued bills to longer dated bonds, which is artificially suppressing the latter’s yields, causing a sort-of shadow catalyst for liquidity.
But the big picture is that worldwide there is around $350T in debt, where on average $70T must be refinanced every year. This creates a periodicity to global liquidity, where cycle nadirs correlate with financial stress and crises that are faithfully remedied by another round of money printing, which then catalyzes the start of the next cycle of global liquidity. Since the GFC, global liquidity has increased on average by about 8% per year.
This liquidity reprices scarce assets like real estate, crypto, and the S&P 500. To observers that aren’t paying attention to this phenomenon, everything looks like it’s in a bubble. However, to those that are, they realize this likely has to do with currency debasement.
Case Study – Price Appreciation for Top 10 S&P Constituents in 2019 Liquidity Cycle
In this case study, I focused on the time period of January 2019 to January 2022, i.e. the period that correlates with the bull run phase of the 2019 liquidity cycle.
I examined the top ten constituents’ price performance during that period with respect to Morningstar valuations, and weighting positions. Here’s a print of the constituents’ starting positions in the index in January 2019:
Top S&P Companies, January 2019 (Finhacker.cz)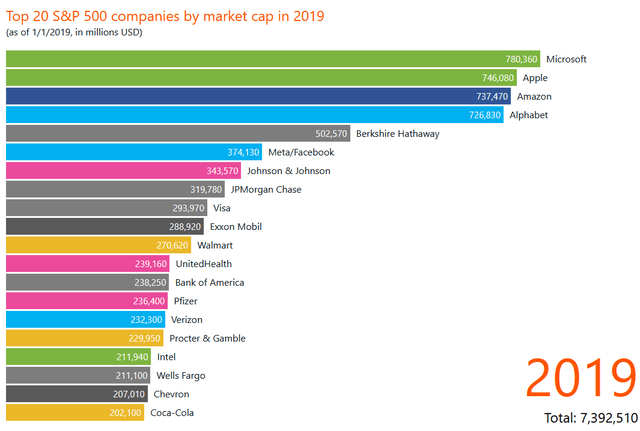
With regard to valuation, there is a correlation between undervaluation and price performance:
Top S&P Stocks – Growth – Price Appreciation % vs Starting P/FV Q1 2019 to Q1 2022 (Morningstar, Schwab) Top S&P Stocks – Price Appreciation % vs Starting P/FV Q1 2019 to Q1 2022 (Morningstar, Schwab )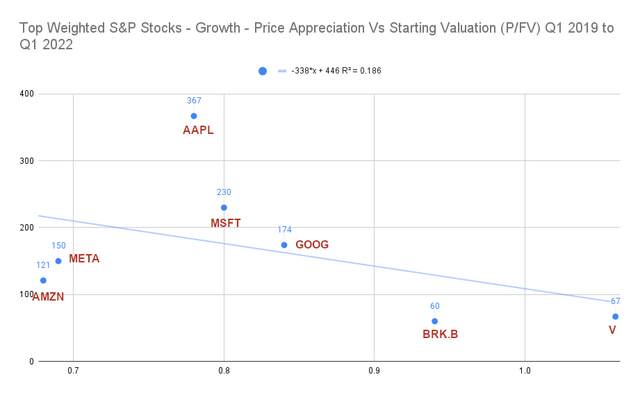
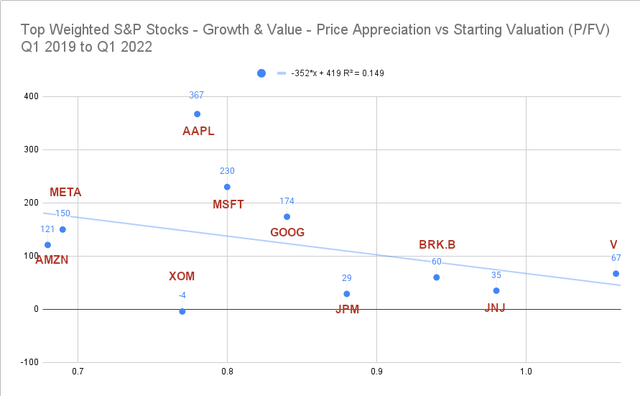
…but it’s a relatively weak one, with the flight to safety to Apple (AAPL) inside this time period skewing the results. But even taking AAPL out of the picture, we’re still looking at an R squared of only 0.3, with Microsoft (MSFT) being the biggest offender:
Top S&P Companies – Growth ex AAPL – Price Appreciation % vs Valuation (P/FV) Q1 2019 to Q1 2022 (Morningstar, Schwab)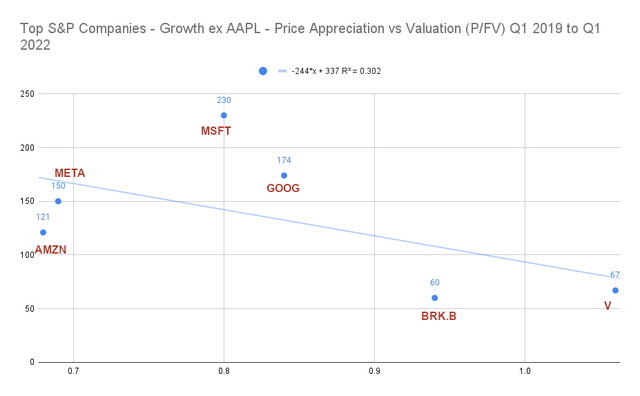
What was more predictive of price performance was a stock’s relative weighting at the top of the S&P. Those at the very top of the S&P were likely to do better than those further down the line:
Top S&P Companies – Growth & Value – Price Appreciation vs Starting Position, Q1 2019 to Q1 2022 (Finhacker.cz, Schwab)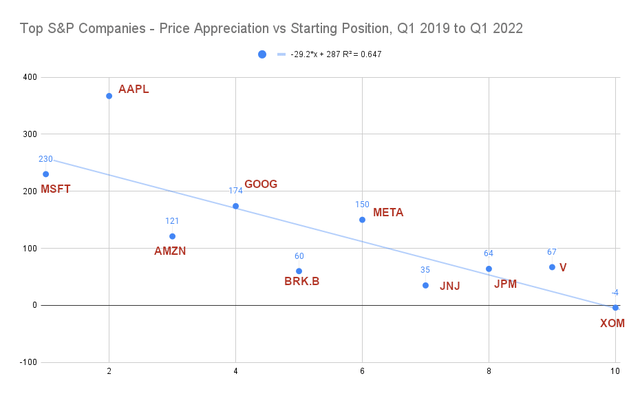
This trend was justified by fundamentals, as it held even for Morningstar fair value appreciation:
Top S&P Companies – Morningstar Fair Value Appreciation % vs Starting Position, Q1 2019 to Q1 2022 (Morningstar, Finhacker.cz)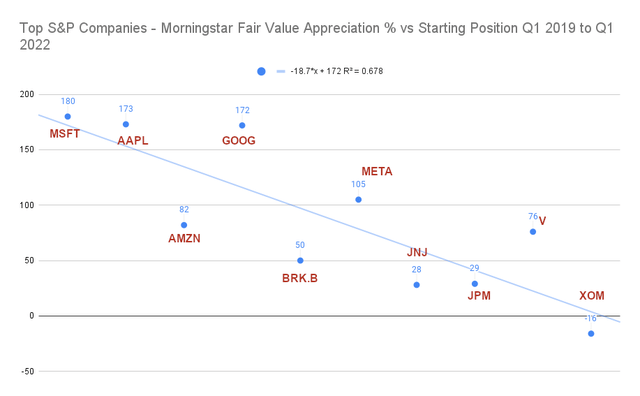
And it held for earnings growth. The magnitude of a given company’s earnings growth correlated with its position in the S&P.
Top S&P Companies ex BRK.B – Fair Value Appreciation % Based on Earnings Growth vs Starting Position – Q1 2019 to Q1 2022 (Morningstar, Macrotrends.net, Andrew Feazelle)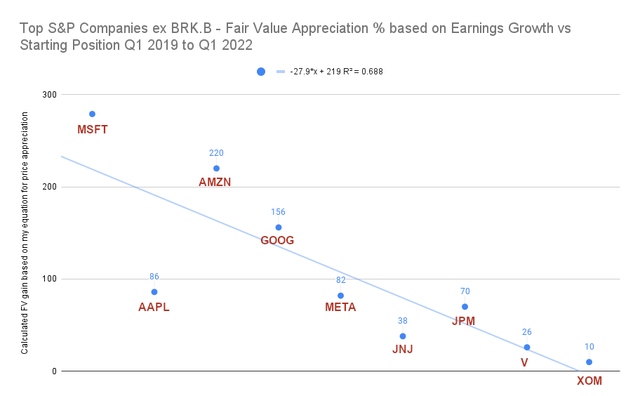
This particular chart is ex Berkshire Hathaway (BRK.B) as the Macrotrends.net data set I was using had an anomalous skew between 2018 EPS and 2019 EPS for BRK.B, which didn’t work with my equation:
Fair Value Appreciation Equation Based on Earnings Growth (Andrew Feazelle)
Discussion
Naturally, one would argue that of course the companies with the best fundamentals are going to be the ones with the best price and fair value appreciation. And that this is just a chicken versus egg story, such that the companies that perform the best will be appropriately ordered in the S&P, and in the short to midterm they will likely continue to do so, and be so.
But to reemphasize the focus of the article, it appears that those companies’ ability to garner the best fundamentals is a function of where they started in the S&P at the beginning of the liquidity cycle. And because we can see at the macro level that global liquidity has been the major driver of asset prices since the GFC…
Global Macro Investor Liquidity Index vs NASDAQ (Global Macro Investor)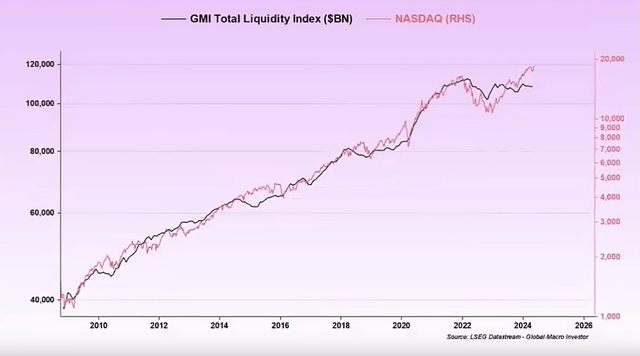
… with such eventually affecting earnings, it’s also not inconceivable that this continuous stream of ‘dark matter capital’ is responsible, to some degree, for this predictive ordering in the S&P.
Consider, before the GFC, the top positions of the S&P had on average more regime change quantized at the yearly level. For the top 5 slots of the S&P, turnover has fallen 47%, comparing 1991-2001, i.e. pre-quantitative easing period, versus 2014-2024, i.e. inside the current era of money printing.
Constituent Turnover of Top 5 S&P 500 Companies (Finhacker.cz, Andrew Feazelle)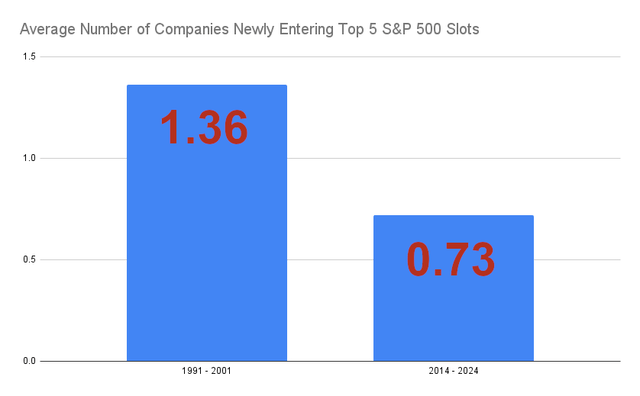
Michael Burry has a more ominous take on the phenomenon, calling it a ‘passive investing bubble’. From his perspective because the largest three investors in, say, MSFT are State Street, with its SPDR S&P 500 ETF Trust (SPY) fund and related funds, Vanguard, with its Vanguard S&P 500 ETF (VOO) fund and related funds, and Black Rock, with its iShares Core S&P 500 ETF (IVV) fund and related funds, passive investors in these ETFs are distorting the natural price and price multiple of the stock, and by extension, its natural place in the S&P.
Top holders of Microsoft, late July 2024 (Yahoo Finance)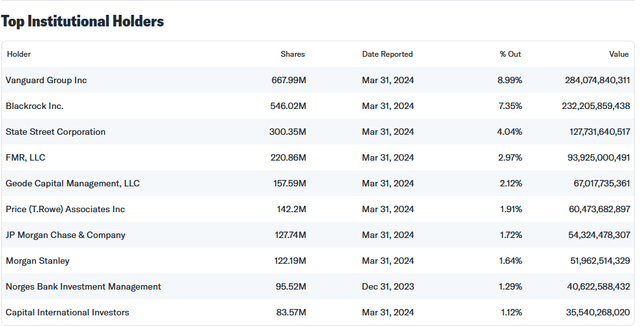
However, as previously noted, the more towards the S&P’s top a particular stock was, during the 2019-2022 liquidity bull run, the better its fundamentals performed on average, justifying its position.
Further, as previously mentioned in my article SPY: Higher Multiples Are Justified, simply examining price to earnings ratios is not sufficient in evaluating these faster growing, internet-based companies, regarding valuations. At the end of the liquidity bull run in late 2021/early 2022 this is what valuations looked like for the S&P’s large cap tech:
| Company | Price to Fair Value in January 2022 (end of global liquidity bull run) |
| MSFT | 0.96 |
| AAPL | 1.48 |
| AMZN | 0.83 |
| GOOG | 0.85 |
| META | 0.82 |
Source: Morningstar, Schwab
The only stock in a bubble at that point was AAPL.
But at the very least, Michael Burry is showcasing one of the means in which global liquidity may be seeping into these ‘long-duration asset’ growth stocks. Though macroeconomist Raoul Pal is adamant that these price resets can’t be explained by capital flow volumes, and that currency debasement works mysteriously to affect prices and price multiples.
I should add incidentally that Simplify’s Mike Green is also in the Burry camp, and explains that a passive fund’s inflows can even distort the fundamentals of its constituents’ to the upside, the magnitude of such being a function of where a particular constituent exists in the fund’s weighting. This is because these large tech companies have the ability to dilute shares and sell to passive buyers of these ETFs, allowing them to pay premium wages for top talent, and garner larger employee numbers, which then translates to larger cash flows down the line.
And again, the counterargument to this is that it’s not just companies at the top of passive funds that are experiencing multiples expansion. It’s crypto, real estate, gold, etc. Further global liquidity expansion and the NASDAQ are correlated in the high 90% range, as shown above in the GMI slide.
Projecting to 2025
Now that we’ve examined how the top S&P stocks behaved in the last liquidity cycle, we may be able to apply such to the current cycle to figure out which companies will likely outperform with regard to price. I’ll focus mostly on big tech, as those are the most sensitive to liquidity, out of all the top S&P stocks.
The current cycle was born in Q4 of 2022, so our line-up looks something like this:
Top S&P 500 stocks in January 2023 (Finhacker.cz)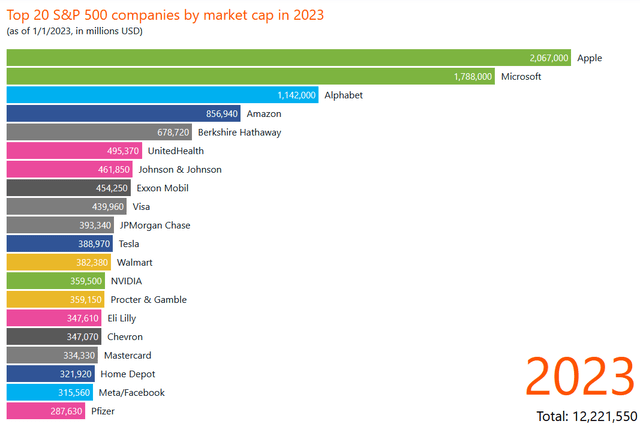
As we can see, it’s again our usual suspects:
| Company | Current Forward Earnings Growth | Current Forward OCF Growth | P/FV in January 2023 | P/FV in August 2024 |
| AAPL | 6.66% | 4.01% | 1 | 1.17 |
| MSFT | 16.64% | 20.36% | 0.72 | 0.83 |
| GOOG | 24.06% | 17.79% | 0.55 | 0.90 |
| AMZN | 23.88% | 46.14% | 0.57 | 0.85 |
Source: Seeking Alpha, Morningstar (Forward Earnings and forward OCF Growth Data captured first week in August 2024, P/FV captured August 12th, 2024)
Let’s examine how each performed over the last two liquidity cycles. The stock’s price indexes constructed below, for each cycle, are from approximately each liquidity cycle’s nadir to 36 months out, capturing the better part of their bull runs.
Global Liquidity Cycles (YoY change) and ISM Index (YoY Change) Pushed 15 Months Forward (Global Macro Investor)
Amazon
During the 2015 global liquidity cycle, AMZN managed to 3.43x in price, while in the 2019 cycle, it went up 1.93x, with respect to monthly closings.
Amazon price appreciation over last 3 liquidity cycles (index zeroed at 100) (Yahoo Finance, Andrew Feazelle)
Were it to perform at an average over the last two cycles, then it would appreciate 2.68x in the bull run of the current one. That puts it around $225 from its December 1, 2022 close of $84, near its nadir, or $276 from its January 1, 2023 close of $103.13.
Using my fundamentals-based price targeting method…
Fundamentals based price target method (Andrew Feazelle)
…and inputting Amazon’s current Morningstar fair value of $195, and projected earnings growth from Seeking Alpha of 23.88%, we have a 1-year fair value target of $241 or a December 2025 target of $254.
| Method | Fair Value Target |
| Liquidity cycle-based target from December 2022 nadir | $225 |
| Liquidity cycle-based target from January 2023 | $276 |
| 12 month target based on earnings growth and return to fair value | $241 |
| 16 month target based on earnings growth and return to fair value | $254 |
| Average late 2025 fair value target | $249 |
So we’re looking at mid $200’s for the end of the current liquidity cycle. Keep in mind that even though traders were not happy with Amazon’s latest quarterly reporting, that Morningstar increased its fair value from $193 to $195 (see slide below) in response to such. Further, AMZN is usually valuated around its P/OCF ratio. And if it did expand OCF by 46.14%, per the early August 2024 prints on Seeking Alpha, then that could pull its fair value into the upper $200’s.
Also, keep in mind, Morningstar did increase its fair value in the 3rd year of the previous liquidity cycle, but subsequently drastically reduced it during the ‘macro winter’ or last year of the cycle when global liquidity growth went negative. Such is the cyclical nature of AMZN.
Morningstar Fair Values for AMZN (Morningstar)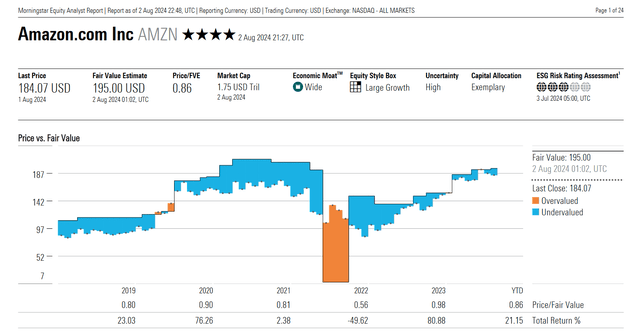
Microsoft
During the 2015 and 2019 cycles, MSFT’s price appreciated by 1.88x and 3.22x, again with respect to monthly closings:
Microsoft Price Appreciation during bull runs of the last 3 liquidity cycles (Yahoo Finance, Andrew Feazelle)
And due to the stock’s relative predictability over the bull runs of the liquidity cycles, we can draw similar conclusions, as we did above for AMZN.
| Method | Fair Value Target |
| Liquidity cycle-based target from 2022 nadir (Oct 1, 2022 = $228.61) | $597 |
| Liquidity cycle-based target from January 1, 2023 | $640 |
| 12 month target based on earnings growth and return to fair value | $571 |
| 16 month target based on earnings growth and return to fair value | $593 |
| Average late 2025 fair value target | $600 |
Here we have an aggressive upper $500’s to lower $600’s, by the end of the cycle. This particular stock’s fair value was consistently raised in a linear fashion throughout the bull of the last liquidity cycle. And in the third year of that last cycle, fair value appreciated from mid $200’s to mid $300’s; all the while the price hung close to it. This implies the fair value still has room to run for late 2024 and 2025:
Morningstar Fair Values for MSFT (Morningstar)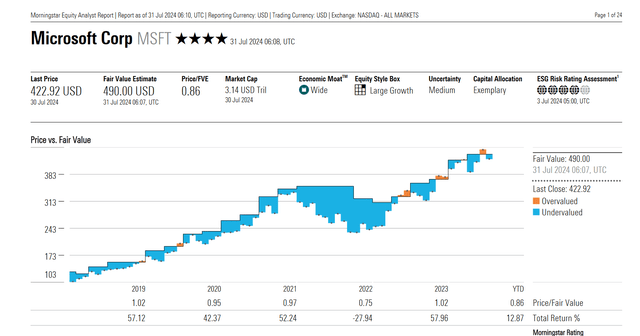
Alphabet
GOOG appreciated at 2.01x for the 2015 cycle and 2.42x for the 2019 cycle:
Alphabet Price Index with respect to the previous and current liquidity cycles (Yahoo finance, Andrew Feazelle)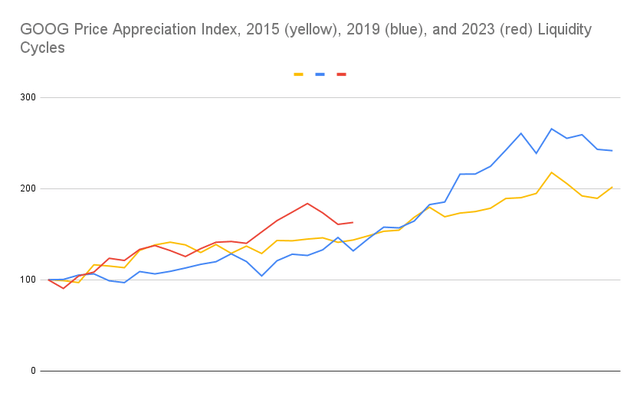
My expectations are that GOOG would likely perform in a similar manner to AMZN and MSFT with regard to previous liquidity cycles:
| Method | Fair Value Target |
| Liquidity cycle-based target from 2022 nadir (Dec 1, 2022 = $88.73) | $197 |
| Liquidity cycle-based target from Jan 1, 2023 = $99.87 | $222 |
| 12 month target based on earnings growth and return to fair value | $226 |
| 16 month target based on earnings growth and return to fair value | $238 |
| Average late 2025 fair value target | $220 |
We’re looking at low $200’s by the end of the bull run of the current cycle. Again, these are peaks before ‘macro winter’ (2026) where liquidity will be withdrawn.
And we have significant fair value appreciation in the 3rd year of the 2019 liquidity cycle bull. Again, this could imply more fair value appreciation for late 2024 and 2025, once the Fed cuts rates, giving it and the PBOC leeway to print money.
Morningstar fair values for GOOG (Morningstar )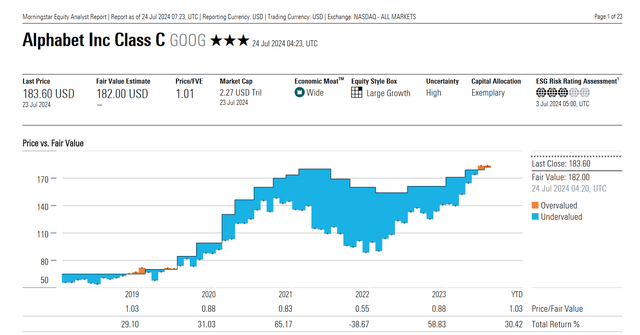
Apple
AAPL did anomalously well during the 2019 liquidity cycle, with a large part of those gains in the wake of the massive March to June 2020 Fed balance sheet expansion, such that I modified my liquidity-based price target calculation for it:
I used today’s price (weekly close for the week of August 5th) and the average of what gains were had from correlated points in previous cycles to their bull run ends. At this point in the cycle, AAPL’s price went up 1.44x in the 2015 cycle bull run, and a 1.52x in the 2019 cycle. At the time of writing, AAPL’s closing price is $216.24, and thus our liquidity-based price target for late 2025 is $320.
Apple’s price appreciation during the 2015, 2019, and 2023 liquidity bull runs (Yahoo Finance, Andrew Feazelle)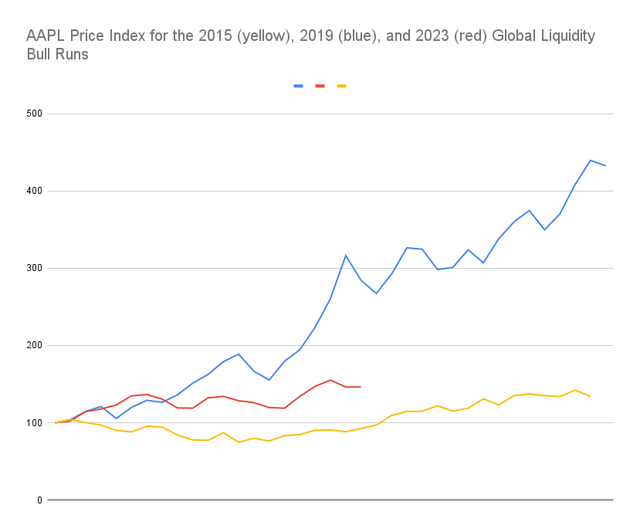
Apple’s late 2025 fair value, based on fundamentals, using the Morningstar fair value of $185 and earnings growth of 6.66% provides a 12-month fair value of $197 and a 16-month fair value of $200. However, keep in mind AAPL consistently stays well above fair value, so a more appropriate late 2025 target, considering it stays anywhere from approximately 15 to 45% overvalued, is $230 to $290, the average being $260.
AAPL is always overvalued, other than at the end of liquidity cycles (Morningstar)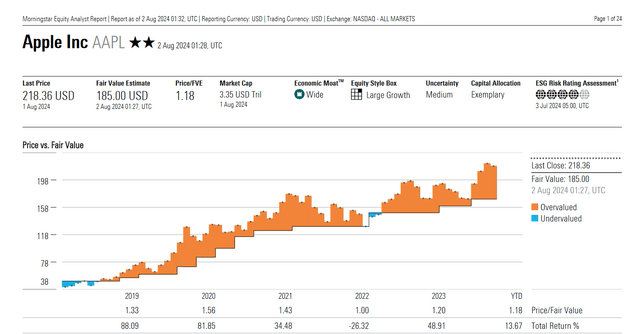
Here, I’m providing price targets that are above fair value:
| Method | Price Target |
| Modified liquidity cycle (middle of bull run) based on current price ($216.24) | $320 |
| Late 2025 fair value + historical premium | $260 |
| Late 2025 price target average | $290 |
AAPL and MSFT’s targets are rich, but keep in mind, they’ve been holding steady at the top two positions in the S&P thus far in the current cycle, and therefore are the biggest recipients of fund inflows, and what excess liquidity may have been out there since the start of the cycle.
Thus, once the Fed Funds Rate comes down, in the face of a likely tepid economy, and then subsequent balance sheet expansion starts to occur, to monetize Covid era related expenditures, or for the part of the PBOC, to shore up China’s housing market, etc., we should start to see the effects of positive YoY liquidity on these prices.
And if we see the relationship between Fed net liquidity (Fed balance sheet minus Reverse Repo, and minus TGA), and interest payments on government debt hold:
Fed net liquidity vs interest expense on US debt (Global Macro Investor)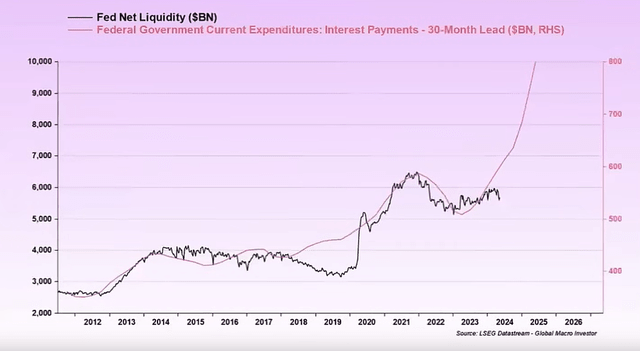
…then there is a higher likelihood we should be able to reach those richly priced targets.
Tesla (TSLA) and Meta Platforms (META) happened to be out of favor during the start of the current liquidity cycle, and therefore they are not included in my 2025 targets for this particular thesis.
Fading the Small-Cap Rotation
Recently, Bank of America (BAC) and JPMorgan (JPM) issued analyses calling for the outperformance of small caps in the coming months:
Small caps outperform large caps after rate cuts – 50 year average (Bank of America) Small cap Trump trade based around the 2016 election (JP Morgan)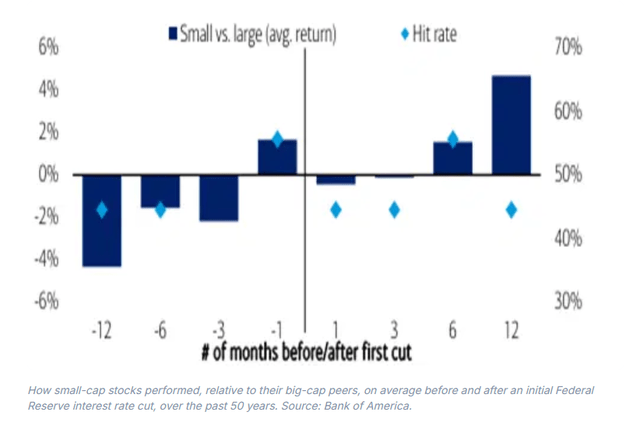
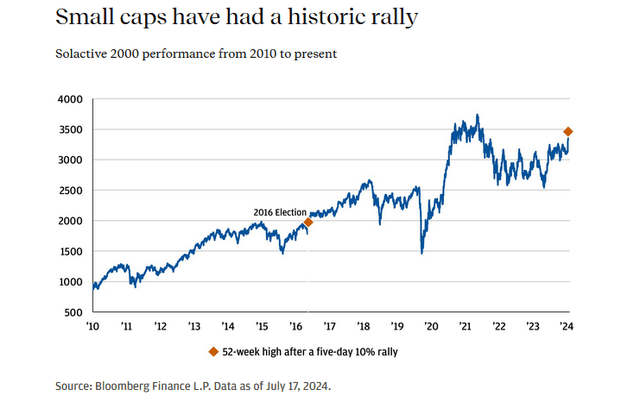
Per PredictIt, there is a 63% chance that a Republican will win the presidential election, up eight percentage points from just a month ago. As we noted in our Mid-Year Outlook, small-cap equities would likely benefit from the prospect of lower taxes and less onerous regulations. For only the second time in the index’s history, the Solactive 2000 rallied to a new 52-week high after a five-day 10% rally. The only other instance? November 11, 2016, the business day after national election polls closed and Donald Trump became President-Elect. The index rallied a further 7% over the next month and was 14% higher a year later. – What’s Driving the Rotation into Small Cap Stocks? JP Morgan, July 19, 2024
(We should note that since this report was published that the polls are showing a much more even race, regarding who will win the presidency this year.)
Small caps look cheap and near the bottom of a multi-decadal cycle (JP Morgan)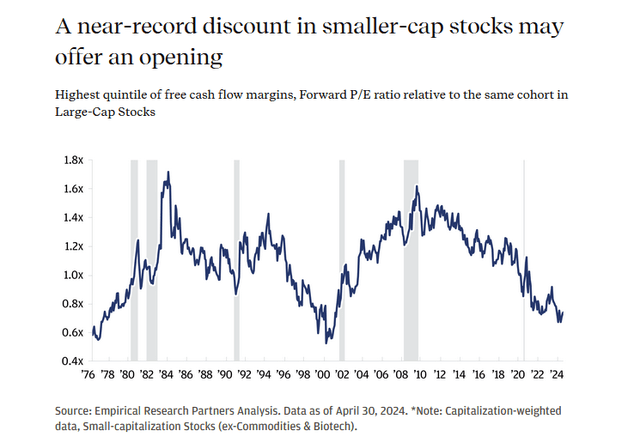
These alongside the recent correction in big cap tech had investors talking about a small-cap rotation, or at least the breaking of the Mag 7 type stocks, as traders pulled out of these, and reallocated to stuff with strong projected earnings growth. This is only a few years past the 2022 global liquidity winter, where traders traded out of big tech and into value, in response to inflation.
However, it’s a natural part of the liquidity cycle, that at some point in its bull run, earnings and earnings projections start to pick up, and value tends to do well. Hence, I don’t believe there will be a mass exit from big cap tech to reallocate into small caps, at least to the degree in which big cap tech suffers mid to long-term price stagnation, like in the 2000s.
Consider the context in which the small-cap price multiple expansion happened in the 2000 to 2010 era. Internet tech was in a bubble. Everyone was wanting to get the latest computer and internet related hardware, to work around the Y2K computer problem, and thus Cisco (CSCO) i.e. the picks and shovels of the internet, was in a bubble, as there’s only so much everyone needed to upgrade. Eventually, big cap tech found gravity, with names like AMZN experiencing 80%+ draw-downs, causing a lost decade for early investors.
That same setup is not currently present, as shown above in the current valuations of our short list of top S&P stocks in the previous section.
The caveat being that AAPL traders had a few weeks ago, true to their long-term behavior, once again bid the stock up to that bordering on probable correction territory, from a value investor’s perspective; however it’s at this point in the liquidity cycle where valuation expansion is probable.
AAPL valuation expansion happens through macro summer and fall in liquidity cycle (Morningstar, Andrew Feazelle)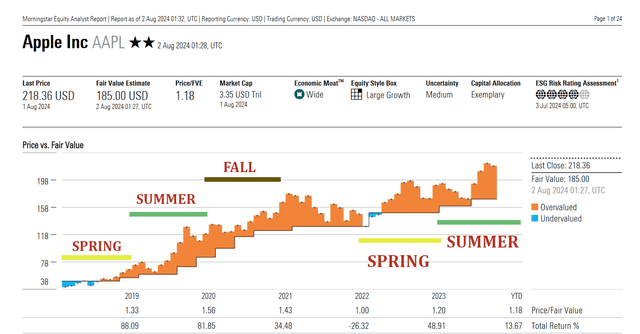
Further, I consider the small-cap boost post the 2016 election, showcased above, in the JPM analysis a coincidental phenomenon, and again, just part of the liquidity cycle.
Indeed, the ISM index cycle, S&P 500 and broad index cycle, Bitcoin halving cycle, and US presidential election cycle are roughly synched together, with most of these being a function of the global liquidity cycle, the latter, of course, not being so. (See slide of ISM vs global liquidity earlier in this article)
You can see this phenomenon play out similarly in the 2019 to 2022 cycle:
IWM outperforms S&P at some point in the liquidity cycle bull (Seeking Alpha )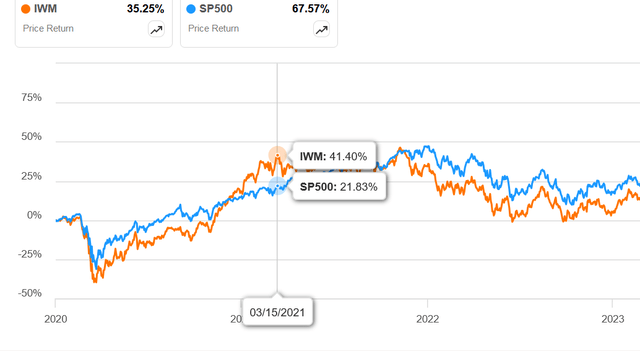
I consider it more likely that big cap tech had a good run, and is in the middle of a natural correction, which needs to occur before the next leg up can be accomplished, than that traders are abandoning big tech for small caps, to the former’s detriment in the rest of the cycle. Once the liquidity starts to flow, likely the top of the S&P will push the index higher.
Upcoming Liquidity
In late July, Econ PI was showing us leading indicators and mean of coordinates in contraction, with the weighted mean of coordinates in decline.
Econ PI Current Economic Conditions for US (Econ PI)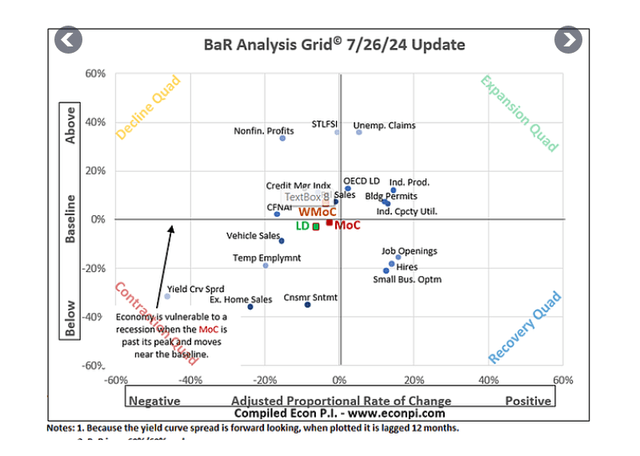
The latest print has leading indicators moving slightly into recovery, but MOC still a tad into contraction:
Latest Econ PI print for early August 2024 (Econ PI)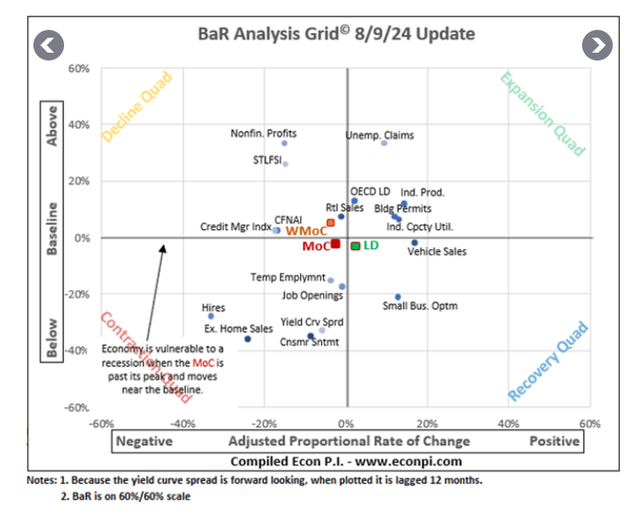
This slowing economy is actually good for risk assets, as major governments will want to stimulate under sluggish economic conditions.
Thus far in 2024 we’ve had liquidity sources such as the continued draw-down of the Reverse Repo:
Reverse Repo draw down (St Louis Fed)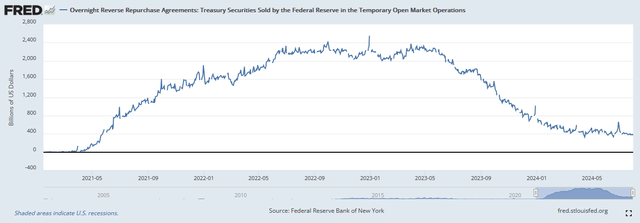
…and we’ve had the Treasury starving the market of longer dated bonds, creating the equivalent of around 100 basis points in Fed Funds Rate cuts, according to Nouriel Roubini from Hudson Bay Capital.
As we near the January 2025 debt ceiling, it is likely the Treasury will once again start drawing down its general account. Were it to repeat its behavior around the 2023 US debt ceiling, it could draw down the account to the tune of the current $774B to less than $100B, between now and whenever a new agreement is struck in Washington in 2025.
TGA and the latest debt ceiling crisis (St Louis Fed)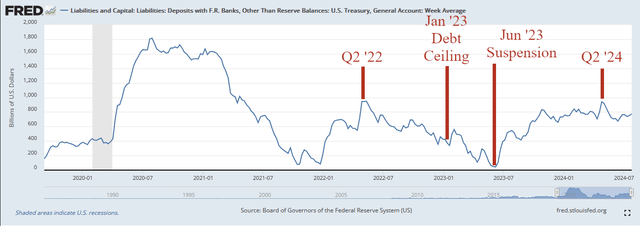
The dollar-yen could be another source of liquidity, paradoxically. The BOJ recently pushed up its short-term rate to 0.25% and agreed to less aggressive bond purchases towards Q1 of 2026. The July FOMC meeting, on the other hand, has put traders in a more bullish camp regarding the probability of Fed rate cuts in coming months. This could give dollar starved China some relief, via swap lines between the BOJ and the PBOC, allowing it to more effectively purchase Treasuries going forward.
However, after having seen the effects of the rate increase and promised quantitative tightening, where the Nikkei fell 12% in a day on August 5th, the deputy governor of the BOJ announced that 0.25% was all that was in the cards for now. Whether this was just to calm volatility or not is yet to be seen.
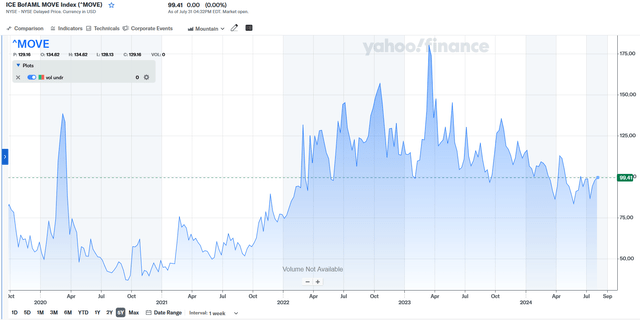
Back to the Treasury, we have Janet Yellen replacing ‘off the run’ (stale) bonds with ‘on the run’ (newly issued) bonds, as the latter is more favored by institutions. This reduces bond market volatility and pushes the Move Index down:
…if the “safest” and most liquid collateral in the world, US Treasury’s volatility is trending higher, it forces leveraged players to sell assets, whether they want to or not. Conversely, if the “safest” and most liquid collateral in the world, US Treasury’s volatility is trending lower, hedge funds, and those borrowing money see calmer waters. The lower collateral volatility incents higher margin borrowing balances. It no longer forces leveraged players to sell assets, whether they want to or not. They exhale first and start to slowly return to buying and levering portfolios. – Oak Harvest Financial Group, The MOVE Index – Bond Volatility and Its ‘Collateral’ Effects
Freddie Mac second mortgages may be in the works in the future: In June 2024 the FHFA announced conditional approval of a pilot program for second mortgages. The pilot is limited to $2.5B, but if successful, and the program becomes generalized, this could be a large source of future liquidity, perhaps even in the trillions of dollars range.
Basel IV, which began rolling out in 2023, and will continue to do so for several years, basically increases capital to risk-weighted-asset ratio requirements for banks, and requires that capital to be more heavily weighted with the highest quality reserves. Banks will be forced to buy more government bonds, pushing down yields and thus increasing liquidity.
Europe and China’s green energy transition: It takes a lot of money printing (on the fiscal side) to transition away from fossil energy. However, once it’s done, this will be a productivity booster as it will drive down the cost of energy. That should help alleviate debt growth requirements for GDP growth in the future, but as these countries are still in the midst of the transition, they do require debt up front.
And the big daddies of global liquidity catalyzation are the Fed and PBOC balance sheets. Based on the charts below, there is a strong likelihood that when push comes to shove, these central banks will expand their balance sheets to keep the game going for one more cycle:
Fed Net Liquidity and Government Debt as a % of GDP (Global Macro Investor)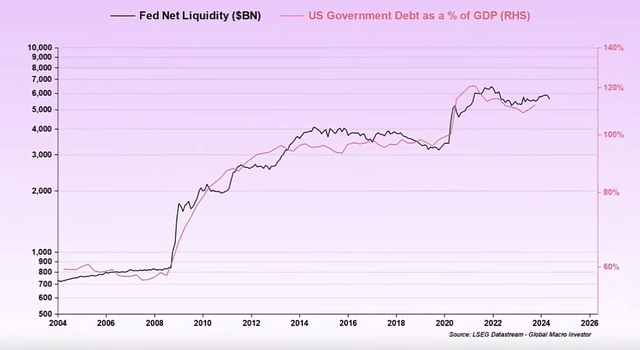
…and below is the same chart I published earlier in the article, but it’s worth reemphasizing that these central banks are monetizing government debt, to keep the system from collapsing:
Fed Net Liquidity Seeks to Monetize Government Debt (Global Macro Investor)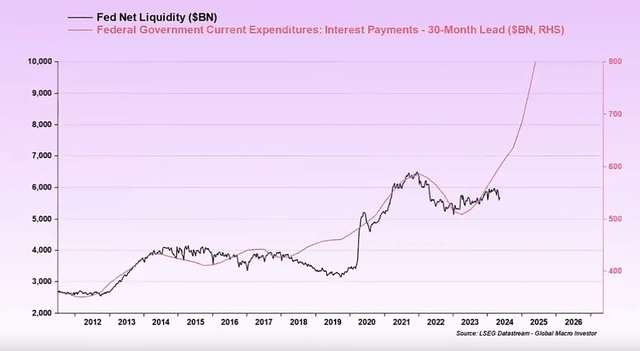
China is suffering with the popping of their real estate bubble, and would love to print, but likely they’re waiting for Fed balance sheet expansion and rate cuts, before doing so, as that’s what the Western world has asked of them.
Takeaway
Based on my case study of the price appreciation of the top stocks in the S&P 500, over the 2019-2022 global liquidity cycle, those large cap growth companies that occupy the very top of the S&P 500 tend to benefit the most from liquidity bull runs.
Were similar dynamics from the last two cycles to continue for the present one (2023 to 2026), AAPL, MSFT, GOOG, and AMZN should be solid investments up to the end of the liquidity bull run, which is likely in mid to late 2025, based on the periodicity of the previous cycles. If Fed Net Liquidity begins to approach $10T, it is likely that AAPL and MSFT especially will benefit; they being at the very top of popular passive funds, like the SPY, VOO, and IVV, currently and back at the beginning of the cycle.
