guvendemir
Investment Thesis
I last covered the Invesco Aerospace & Defense ETF (NYSEARCA:PPA) on May 2, 2024, when I reiterated my buy rating. I based this call on PPA’s superior quality and diversification features over competitors like the iShares U.S. Aerospace & Defense ETF (ITA) and the SPDR S&P Aerospace & Defense ETF (XAR), but PPA has lagged these peers in the three months since by 1-2%.
I don’t think this underperformance is anything to worry about. Still, I would like to revisit my investment thesis to ensure PPA’s fundamentals haven’t deteriorated enough to warrant a rating change. I’ll do that below and compare it with two newer Aerospace & Defense ETFs you may want to consider. I hope you enjoy the read.
PPA Overview
Strategy Discussion and Performance Summary
PPA tracks the SPADE Defense Index, which is modified market-cap-weighted and holds approximately 50 companies with products and services related to naval vessels, military aircraft, and missile defense, among others. As a brief recap, I previously had an email exchange with the Index’s founder, who described its creation as a way to track the performance of defense stocks rather than in preparation for launching an ETF, as is often the case. The Index’s backtested returns from 1998 to 2005, which, I believe, are reliable, show solid returns against the S&P 500 except during the dot com bubble:
- 1998: 6.63% vs. 26.67%
- 1999: 15.31% vs. 19.53%
- 2000: 4.98% vs. -10.14%
- 2001: 0.94% vs. -13.04%
- 2002: -2.87% vs. -23.37%
- 2003: 37.27% vs. 26.38%
- 2004: 20.47% vs. 8.99%
- 2005: 5.30% vs. 3.00%
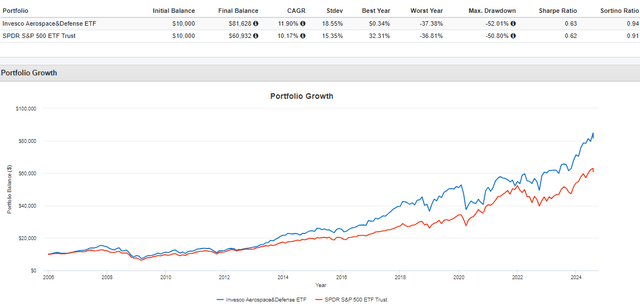
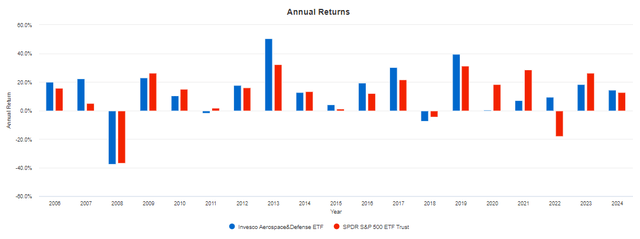
Since January 2006, PPA has outperformed the SPDR S&P 500 ETF Trust (SPY) by almost two percent annually (11.90% vs. 10.17%) despite its high 0.58% expense ratio, suggesting defense stocks are excellent long-term holds. The graph below shows PPA’s lead over SPY compress in 2020-2021, but its “defensiveness” proved its worth in 2022 when it managed a solid 9.51% total return. Meanwhile, SPY declined by 18.17%.
Notably, PPA has only delivered a negative return two times since the Great Financial Crisis, and both times it was negligible. While it’s not immune from large drawdowns like in 2008, the main risk is underperformance during bull markets, and I think that’s acceptable to conservative investors.
Composition Analysis: Boeing Is A Constant For Domestic ETFs
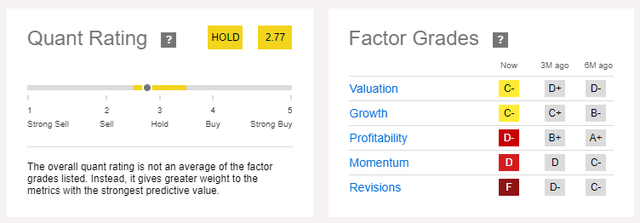
Let’s acknowledge the elephant in the room: Boeing (BA). PPA owns it, and it’s the fourth-largest holding with a 6.37% weighting. That’s enough to make a difference, and I’ll be the first to admit I wish it weren’t there at all. Boeing is highly volatile, richly valued, not profitable, and badly missed earnings expectations last quarter. Seeking Alpha’s Factor Grades also indicate it’s not attractive, despite a 35% price decline this year.
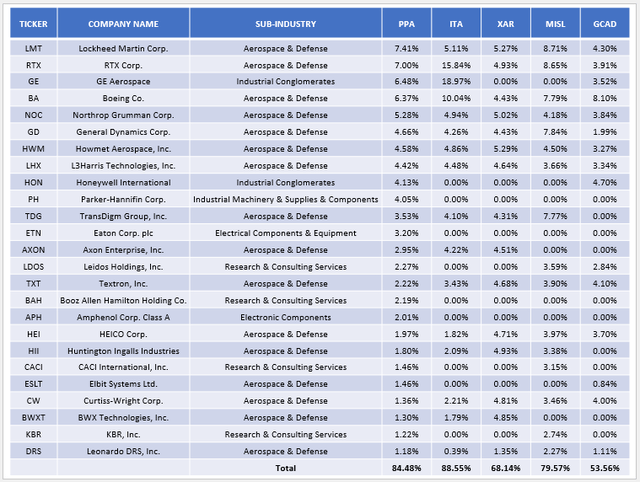
Unfortunately, PPA’s competitors also hold Boeing, and even the equal-weighted SPDR S&P Aerospace & Defense ETF assigns it a 4.43% weighting. Other ETFs, particularly the iShares U.S. Aerospace & Defense ETF, overweight it at 10.04% and are less diversified. Here’s a list of each fund’s overlap with PPA’s top 25 holdings:
Included in the table above are the Aerospace & Defense ETF (MISL) and the Gabelli Commercial Aerospace & Defense ETF (GCAD), two funds I will also evaluate today. For ETFs with some international exposure, I suggest the Global X Defense Tech ETF (SHLD).
GCAD’s 0.00% expense ratio, available until the fund reaches $25 million in assets under management, makes it an exciting choice, and based on its 30.24% return for the one year between August 2023 and July 2024, there might be something to the strategy. MISL also delivered an excellent 29.73% total return compared to PPA’s 29.10%, while XAR and ITA lagged by 6-8%. As shown below, XAR and ITA have also trailed PPA over all periods greater than one year.
PPA Analysis
Fundamentals By Company
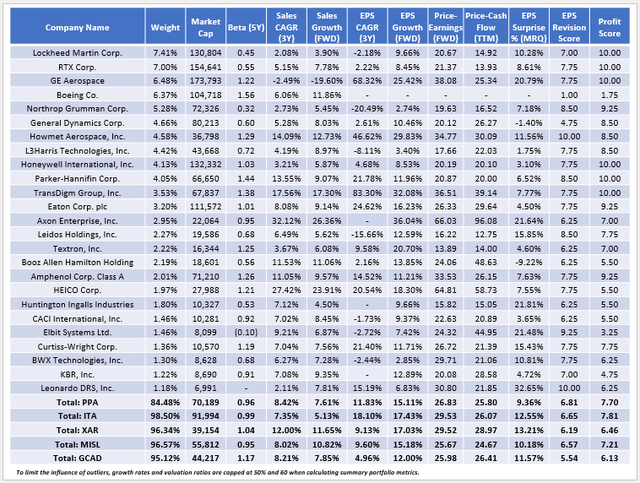
The following table highlights selected fundamental metrics for PPA’s top 25 holdings. At the bottom are summary metrics for ITA, XAR, MISL, and GCAD, whose concentration levels are slightly elevated. Therefore, one takeaway is that PPA is the best diversified of the five.
Here are two additional takeaways to consider:
1. PPA has a solid 7.70/10 sector-adjusted profit score, slightly below ITA’s 7.81/10 but well worth it considering the latter’s diversification issues. Boeing has a 1.75/10 score, and except for SHLD, XAR is your best option if you want to minimize exposure to this stock. Unfortunately, its equal-weight approach is inferior from a quality perspective, as the top stock it overweights relative to PPA is Spirit AeroSystems (SPR), which was acquired last month by Boeing in a deal expected to close in mid-2025. Below is a list of XAR’s top ten overweights and their respective profit scores.
- Spirit AeroSystems Holdings: +4.55% (1.75/10)
- Hexcel Corp. (HXL): +3.68% (6.25/10)
- BWX Technologies (BWXT): +3.55% (6.25/10)
- Curtiss-Wright Corp. (CW): +3.45% (7.75/10)
- Huntington Ingalls Industries (HII): +3.12% (5.50/10)
- Woodward, Inc. (WWD): +2.78% (7.00/10)
- HEICO Corp. (HEI): +2.74% (5.50/10)
- AeroVironment, Inc. (AVAV): +2.69% (3.25/10)
- Textron Inc. (TXT): +2.46% (7.00/10)
- Rocket Lab USA (RKLB): +1.98% (1.75/10)
There is an opportunity for other Aerospace & Defense ETFs to correct the issue of avoiding Boeing and other non-profitable stocks while retaining strong diversification. I was hoping MISL and GCAD would provide that, but their profit scores are also weak and, in the case of GCAD, also more volatile. Its components have a 1.17 weighted-average five-year beta, so when it comes to combining diversification, quality, and risk, PPA is the best choice.
2. ITA has the best one-year estimated earnings growth rate at 17.43% but the worst one-year estimated sales growth rate at 5.13%. The reason is GE Aerospace (GE), which beat bottom-line earnings estimates last month and raised full-year free cash flow guidance from about $5.0 billion to as high as $5.6 billion despite missing top-line expectations. Management mentioned supply chain challenges 13 times in its Q2 earnings update, stating:
Last quarter, we shared that the common denominator impacting growth across both services and new engines is constrained material supply with 80% of material input shortages tied to nine suppliers across 15 supplier sites. This remains our focus today. We have deployed more than 550 of our engineering and supply chain resources into the supply base to use FLIGHT DECK to work hand-in-hand with our suppliers to identify and resolve constraints.
If the plan is successful, ITA will have a substantial advantage over PPA due to its 18.97% weighting. However, the stock trades at 38.08x forward earnings even after falling 5.58% on Friday, and more cautious investors should prefer PPA. Overall, PPA trades at 26.83x forward earnings (23.42x harmonic average), which is a few points less than ITA. It also has better earnings momentum, supported by a 6.81/10 EPS Revision Score.
Politics & Defense Spending
The latest Congressional Budget Office report forecasts U.S. defense spending as a percentage of GDP to remain at 3.0% for 2025 before falling to 2.8% in 2034. However, the decline is debt-related, as net interest as a percentage of GDP is projected to increase from 3.4% to 4.1% between 2025 and 2034.
U.S. Congressional Budget Office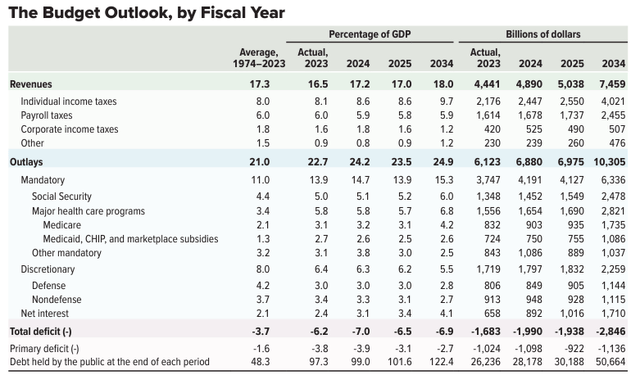
In dollars, the CBO expects defense spending to jump from $849 to $1,144 billion from 2024 to 2034, which is about 3% annualized.
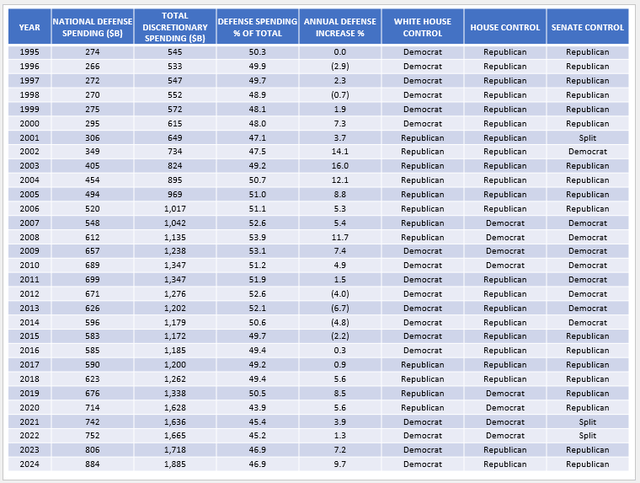
It’s assumed Republicans are more hawkish than Democrats regarding defense spending, and there are solid data to back that up. However, which party controls the House of Representatives and the Senate matters, too, given how both houses of Congress are responsible for passing their own budget resolutions. To illustrate, consider the following table I compiled, summarizing national defense spending as a percentage of total discretionary spending from 1995-2024. My sources were this table provided by the Office of Management and Budget and historical data on party control for the House and Senate.
Consider the average annual increases under various scenarios:
- Republican White House: 8.1% (12 Years)
- Republican House: 3.6% (22 Years)
- Republican Senate: 4.8% (18 Years)
- Democrat White House: 1.5% (18 Years)
- Democrat House: 6.1% (8 Years)
- Democrat Senate: 3.3% (9 Years)
- Split Senate: 3.0% (3 Years)
- Divided Leadership: 2.9% (22 Years)
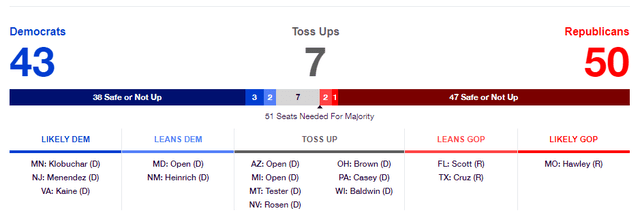
These statistics indicate that a Republican Senate would favor higher defense spending, as the sample size (18 years) and the average defense spending increase (4.8%) are high. I mention this because the latest “RealClear Politics” map suggests Republicans are favored to win the Senate, with 47 seats declared either “safe” or not up for election and all the “toss-up” states currently represented by Democrats.
Moreover, Democrats are defending three seats in states won by Donald Trump in 2016 and 2020, while Republicans are not defending any seats won by Joe Biden in 2020 (West Virginia, Montana, Ohio). This all adds up to at least divided leadership, which is positive for Aerospace & Defense stocks.
Investment Recommendation
I believe a strong defense is crucial to national security, and since the CBO projects about 3% annualized spending growth over the next 10 years and Republicans are favored to win the Senate in November, the Aerospace & Defense industry has a good chance at succeeding over the long term. ETFs are simple ways to gain exposure, as picking winners and losers can be challenging. While Boeing has declined 49% over the last five years, others, like GE Aerospace, have more than doubled in value.
PPA is an excellent choice, as it tracks an Index with a long history of outperforming the market and is the best diversified among its competitors, which include ITA, XAR, MISL, and GCAD. PPA’s quality is also high, its risk is relatively low, and its growth and value mix is competitive. SHLD is another option if you want some international exposure, but for domestic-only funds, I believe PPA is the best of the bunch and have decided to reiterate my “buy” rating. Thank you for reading.

