Corri Seizinger
Happy belated Independence Day, my fellow Americans!
If you’re still suffering some heartburn from too many cheeseburgers and a hangover from too much booze, just remember: You did it for your country. You did it for America.
Here’s where we’re going today:
- More on the potential for a resurgence in trade wars and inflation — and how I would invest in such a scenario
- Lagging data > lagging monetary policy > aggravated boom-bust cycle
- Some of the last holdouts of economic growth are capitulating and increasing the recessionary outlook
Let’s get into it.
Follow-Up On The Tariff Threat & Potential Inflation Resurgence
In last week’s article, “8 Stocks I’m Buying As A Resurgent Trade War Looms,” I discussed the huge body of economic research evincing the overwhelmingly net negative effects of high tariffs and trade wars.
Protectionism may be politically popular, but many economic studies conducted by researchers across the political spectrum concur that tariffs and trade wars do little to protect and nurture domestic industries while greatly burdening consumers and businesses.
If the goal is to generate inflation, there are few government policies better suited to accomplishing this than raising tariffs.
CNBC recently put out an excellent video explainer about the differences between Trump and Biden’s trade policies, and which one would be worse for US consumers.
While last week’s article discussed both Trump and Biden’s economically burdensome trade policies, this week, I’ll focus on Trump’s proposed tariffs, including a 10% across-the-board tariff on all imports.
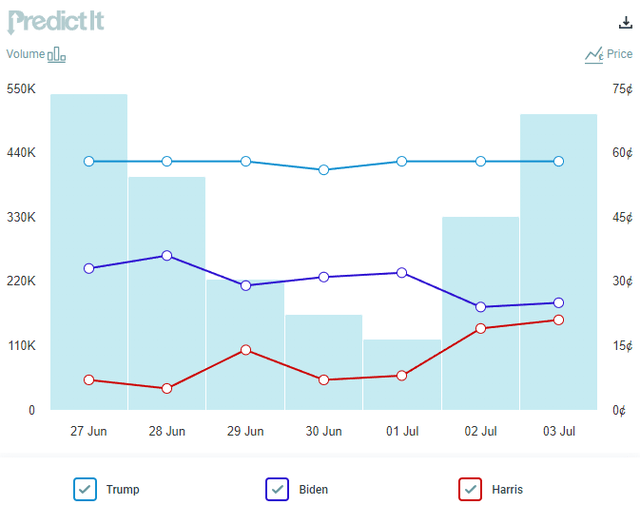
Why focus on Trump? Because, according to prediction markets like PredictIt, Trump is by far the most likely candidate to win at this point.
While the stock market’s recent rally indicates optimism about the potential for tax cuts to be extended, I’m more focused on the likely negative effects of a potentially resurgent trade war.
The trade-friendly defenders of Trump, a man who once dubbed himself “Tariff Man” (I would’ve preferred “The Tariff Sheriff,” but alas, I was not consulted), assert that Trump is only using tariffs as a temporary negotiating chip to get better trade deals with our international trading partners. But according to Trump’s website, his goal is to “bring back our supply chains, and build America into the manufacturing superpower of the world.”
In other words, Trump’s goal is to permanently make international trade more expensive in order to give an advantage to US manufacturing.
The idea here isn’t just to tinker around the edges, incrementally improving trade deals. It is to fundamentally reshape the American economy by expanding manufacturing and punishing consumption. To the degree Trump did renegotiate new trade deals, it was toward this goal of promoting US manufacturing rather than free trade.
As proof of this, simply note that the majority of tariff increases Trump implemented remained in place throughout his term and were kept in place by President Biden.
In last week’s article, I mentioned that multiple think tanks estimate Trump’s proposed 10% across-the-board tariff would cost the average household between $1,500 and $1,700 per year. The center-right think tank American Action Forum adds that Trump’s proposed 60% tariff on all Chinese imports would raise the annual cost to average households to $1,950 annually.
And this does not include the impact of any retaliatory tariffs.
Interestingly, if China imposed retaliatory 60% tariffs on all imports from the US, the average cost to Chinese households would be only $170 annually. But while it would cost Chinese consumers very little, it would likely cost the US many trade-supported jobs.
Sounds like a pretty bad deal to me.
Apparently, it also sounds bad to a group of 16 Nobel prize-winning economists, who recently penned an open letter warning that Trump’s trade policies, if enacted, would likely trigger a resurgence of inflation.
To be fair, these 16 economists erode some of their credibility by criticizing Trump’s “fiscally irresponsible budgets” with no mention of Biden’s equally fiscally irresponsible budgets.
But arguably the most important point they make in the letter is this:
Nonpartisan researchers, including at Evercore, Allianz, Oxford Economics, and the Peterson Institute, predict that if Donald Trump successfully enacts his agenda, it will increase inflation.
Add to that list of nonpartisan researchers Moody’s Analytics, which recently issued a report arguing that Trump’s policies, if successfully enacted, would drive up inflation and likely lead to further monetary policy tightening by the Fed.
Goldman Sachs economist Jan Hatzius concurs, arguing that a US-EU trade war escalation would increase US inflation by 1.1 percentage points while decreasing US real GDP by 0.5 points.
Multiple freight executives also concur, asserting that higher tariffs will flow through their supply lines into higher consumer prices.
On the other hand, credit ratings agency Fitch makes an interesting argument. They argue that tariff hikes would cause only a temporary increase in inflation that would reverse into lower inflation over the medium term. Why? Because the negative economic effects of tariffs would cause aggregate demand to drop, eventually leading to disinflation or deflation in the goods sector.
Bottom line: While my all-else-equal view is that the inflationary surge is over, interest rates will decline somewhat going forward, and the US economy is returning to its pre-pandemic state of low inflation & interest rates, that view could be upended if Trump wins and is able to enact his policy agenda.
I’ve been heavily buying REITs lately, which I view as extraordinarily attractive given my macro outlook. But while REITs generally handle inflation just fine, they perform poorly (on a stock price basis, at least) amid rising interest rates.
What would perform best in an inflation & interest rate resurgence scenario?
In my view, the best stocks for such an environment are high-quality, low-debt, cash-rich, high pricing power, large-cap companies such as those found in the Schwab US Dividend Equity ETF (SCHD) and WisdomTree US Quality Dividend Growth Fund ETF (DGRW).
The former is balanced between value and growth, while the latter is heavily weighted toward technology, which currently accounts for ~30% of the fund.
To illustrate the effect of having lots of cash and little debt on the balance sheet during a period of high interest rates, take a look at the net interest income (interest earned minus interest paid) for two of DGRW’s top 10 holdings:
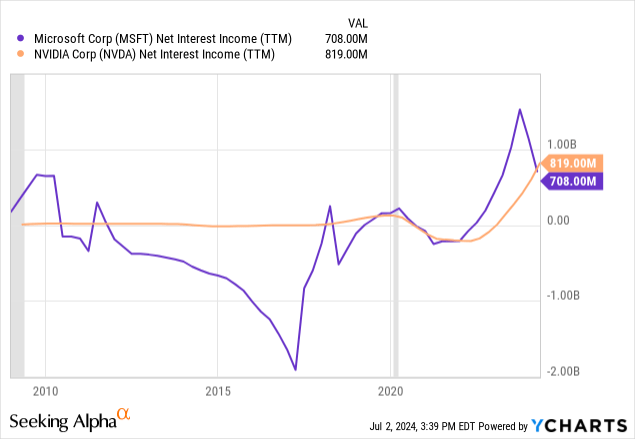
The most cash-rich and low-debt corporations like Microsoft (MSFT) and Nvidia (NVDA) are generating gushers of revenue just from the cash sitting on their balance sheets!
Having a strong balance sheet with lots of cash is itself a hedge against inflation.
The better Trump’s odds of winning the election, the more attractive these types of stocks become to me relative to REITs.
Although I would like to wait for a pullback in tech before buying those high-quality, cash-rich names, which I would do simply by buying DGRW.
The Great Lag of 2024
In the world of online video gamers, your worst nightmare is a bad Internet connection that causes you to lag. Lagging is when what shown on your screen is behind what is happening on the screens of gamers with better connections. Your screen shows what happened slightly in the past, causing your gaming performance and experience to suffer.
Is this a perfect illustration? Maybe not, but stick with me.
The Federal Reserve has been basing their all-important monetary policy decisions on lagging data, and this is greatly inhibiting their ability to set good policy.
Looking back over the last five years, we find that growth in the US money supply peaked in early 2021, and then the US CPI peaked in mid-2022, and then the Fed Funds Rate (“FFR”) peaked in mid-2023.
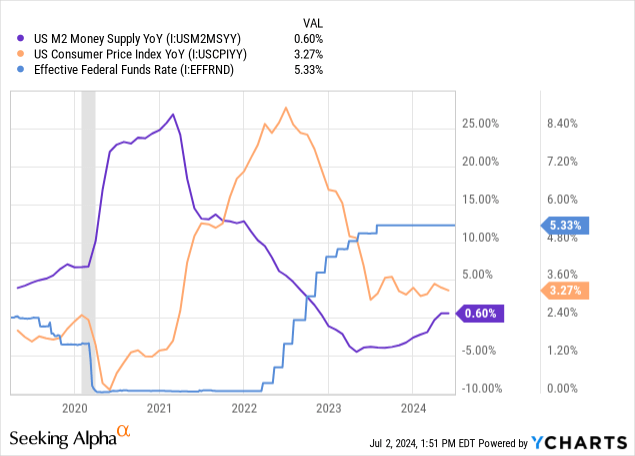
At least in the case of the COVID-era inflation, the money supply was the head of the snake, while inflation was the body of the snake and the FFR was the tail of the snake.
This lag caused the Fed to be extremely late in raising rates, and now it is causing them to be late in lowering rates.
You might object that the CPI still shows inflation over 3%, which is well above the Fed’s 2% target. But the Fed’s inflation data lags real-time price changes in very important and heavily weighted sectors like housing.
Compare, for example, Apartment List’s rent index showing -0.7% YoY rent growth to the CPI’s rent metric still over 5%.
Apartment List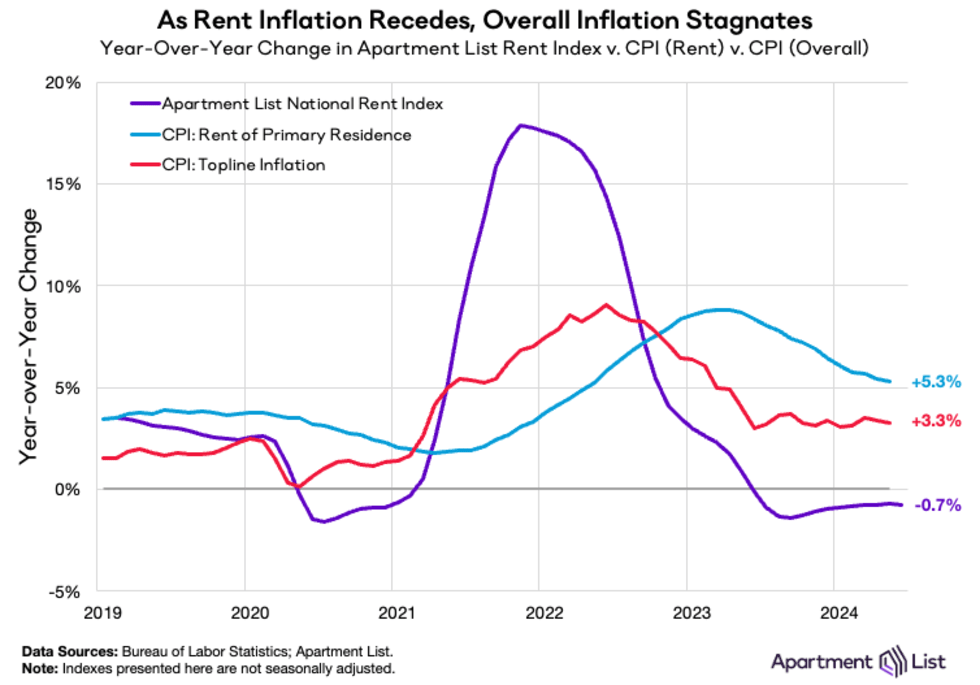
The CPI’s housing inflation metrics peaked a full year after real-time, private sector rent indices did.
In fact, the CPI’s housing metrics also peaked over half a year after the headline CPI index.
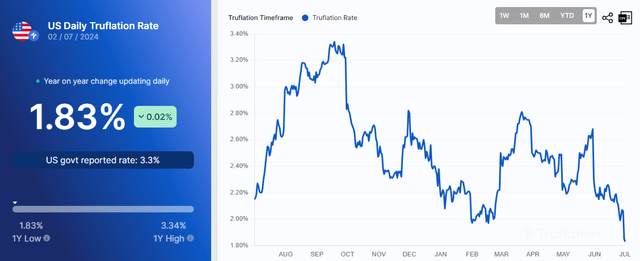
So while the CPI still shows inflation over 3%, arguably better measurements like Truflation now show inflation under 2% and still falling.
Using Truflation, the real (inflation-adjusted) FFR is at its highest level in four decades.
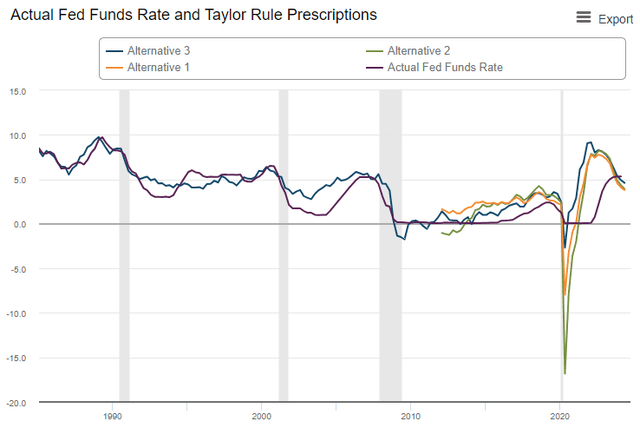
If the Fed used a rules-based approach like the Taylor Rule, the FFR would have already declined 100 basis points by Q1 2024 and 140-150 basis points today.
The Taylor Rule would have pushed the FFR up much faster during the inflationary period of 2021-2022 and would put the FFR at about 3.9% today.
As long as the Fed’s inflation data is lagging and inaccurate, the greater the odds of a “policy mistake” that leads to a recession, which will then cause Fed policy to whipsaw too far and for too long in the opposite direction.
My preference is not for zero interest rates forever. Back in 2019, I was critical of excessively easy monetary policy in articles like “The Monetary Death Spiral.”
But in lieu of a change to how monetary policy is determined, I believe investors should continue to expect Fed policy to continue aggravating the boom-bust economic cycle.
Recession Odds Continue to Tick Up
I continue to believe a recession is coming, in part because of lagging Fed reactions to economic changes but also because the post-COVID spending frenzy is fizzling out.
Already, the Institute For Supply Management’s PMI indices have turned negative (below 50) for both services and manufacturing.
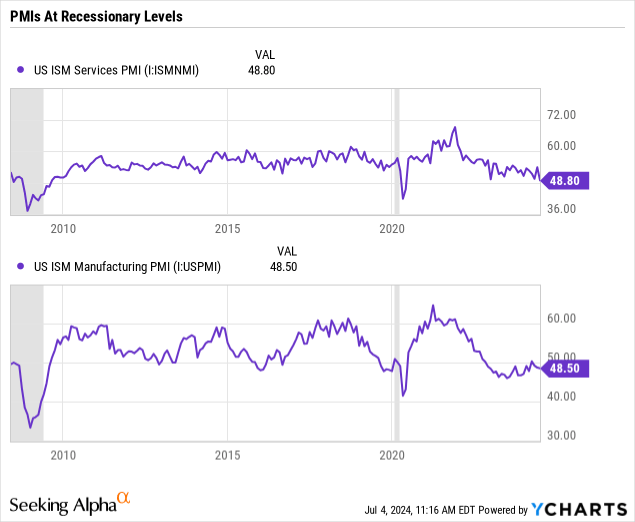
With over 3/4ths of the US economy geared toward services, slipping into negative territory in this area — in addition to manufacturing, which has been negative for years now — is another significant sign of slowdown in the US economy.
I’ve said it many times before, and I’ll keep saying it for as long as it remains true: Broadly speaking, US consumers are losing steam. Their spending power is diminishing.
You could look at the historically low savings rate, and you could also look at US credit card debt and delinquency rates, which have soared higher over the last few years:
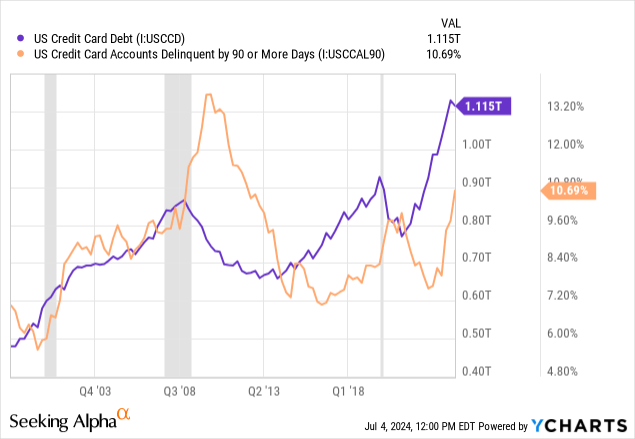
You might observe that the current delinquency rate isn’t as high as its peak during the Great Financial Crisis. But keep in mind two points:
- The GFC was the worst recession since the Great Depression, and
- The credit card delinquency rate is 100 basis points higher today than it was at the beginning of the GFC!
Lots of people bring up the fact that deficit spending is still quite high (~$2 trillion a year ain’t no chump change) as an argument that fiscal stimulus will continue to drive economic growth.
Wrong.
Today’s government spending is fundamentally different than the spending of 2020-2021 that fueled the post-COVID economic surge. Back then, government spending directly funded consumer spending via stimulus checks, enhanced unemployment, and PPP loans that kept workers employed even if they weren’t working.
Today, government spending is driven by Social Security, Medicare, Medicaid, interest expense, and tax credits for the semiconductor and green energy industries.
Today’s government spending may be stimulative and inflationary in certain pockets of the economy, but the government spending of 2021-2022 stimulated the entire economy.
Back then, government spending grew the money supply. Today, it is simply growing the supply of Treasury debt.
The final point I’d make on the subject of recession odds relates to unemployment, which has been slowly rising after bottoming out from mid-2022 to mid-2023.
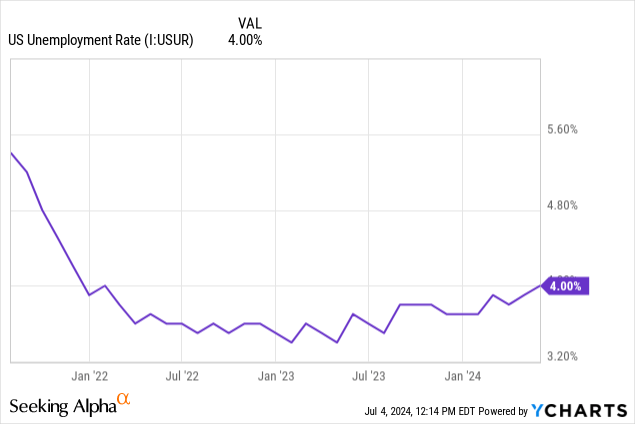
If you look at a snapshot, the labor market still appears quite strong, but the trend is no longer one of strengthening but rather one of weakening.
Historically, once the unemployment rate begins an upward trend, it doesn’t tend to stop moving up before a recession hits.
It’s possible we avoid a recession, of course, but according to historical precedent, the next phase in the cycle would be recession.
And to connect this to the tariffs discussion above, note that if a recession does begin sometime this year, the incumbent president’s chances of winning reelection go down significantly. I would guess that is true of the incumbent president’s party as well, given that the current POTUS may or may not be the presidential nominee for his party.
In short, then, a potential recession this year would increase the odds of a resurgent trade war next year and the years beyond.
My Buy List
A few of my existing holdings have come back onto the buy list this week.
Rising odds of a Trump victory has caused green energy companies like Clearway Energy Inc. (CWEN, CWEN.A) and Hannon Armstrong Sustainable Infrastructure (HASI) to drop. I view this as a buying opportunity for two main reasons:
- The likelihood of even a Republican sweep leading to a reversal of the green energy incentives in the “Inflation Reduction Act” seems low to me. Many of these renewable energy projects are located in Republican states like my home state of Texas, which generates more electricity from renewables than any other state.
- Lower interest rates would have a strongly positive effect on renewable energy companies by lowering their cost of financing investments. It is my view that the US will get lower interest rates over the next few years.
While CWEN directly owns wind, solar, battery storage, and natural gas power generation facilities, HASI’s business model is to act as a financier for both utility-scale and small-scale green energy assets.
At the same time, while I find these renewable energy names attractive, I’m also aggressively building my position in Sempra (SRE), in part for its regulated utility assets in fast-growing Texas but also because of its strong market position in LNG export infrastructure.
SRE owns LNG liquefaction and export terminals on both the West Coast and the Gulf of Mexico, positioning the company to benefit from the growth in American LNG exports both East and West — to Europe as well as to Asia.
| Dividend Yield | Projected Forward Dividend Growth Rate (Guesstimate) | |
| American Tower (AMT) | 3.3% | High-Single-Digit |
| Clearway Energy Inc. (CWEN.A) | 7.3% | Mid-Single-Digit |
| Hannon Armstrong Sustainable Infrastructure (HASI) | 5.7% | Mid-Single-Digit |
| InvenTrust Properties (IVT) | 3.7% | Mid- to High-Single-Digit |
| Rexford Industrial (REXR) | 3.7% | High-Single-Digit to Low-Double-Digit |
| Sempra (SRE) | 3.3% | Mid- to High-Single-Digit |
| Essential Utilities (WTRG) | 3.3% | Mid- to High-Single-Digit |
| Schwab US Dividend Equity ETF (SCHD) | 3.7% | Mid-Single-Digit to Low-Double-Digit |
Where’s Comcast?
I’ve decided to hold off on buying any more Comcast (CMCSA) for now for two reasons. First, though it’s still buyable, I’d prefer focusing on the other names in my buy list in which I have greater conviction. And second, I haven’t finished my deep dive of the company yet.
CMCSA looks extraordinarily cheap at about a 9x P/E ratio and a free cash flow yield of ~8.8%. Even if revenue growth remains slow at 1-3%, CMCSA is only paying out 35-40% of that FCF as dividends, leaving tons of retained cash for buybacks and growth investments.
And management have a pretty good track record of solid capital allocation. The historical return on invested capital (outside of the COVID-19 years) averages 11%, which is where CMCSA’s ROIC has returned over the last four quarters.
That said, there’s still the issue of the dying cable TV industry, which I’ll get to more deeply in a future article.
For now, I’ll simply note that this subscriber loss is not exclusive to cable TV providers like CMCSA.
In Q1 2024, although new subscriptions continued to outpace cancellations for streaming services, streamers still saw record numbers of cancellations.
Chartr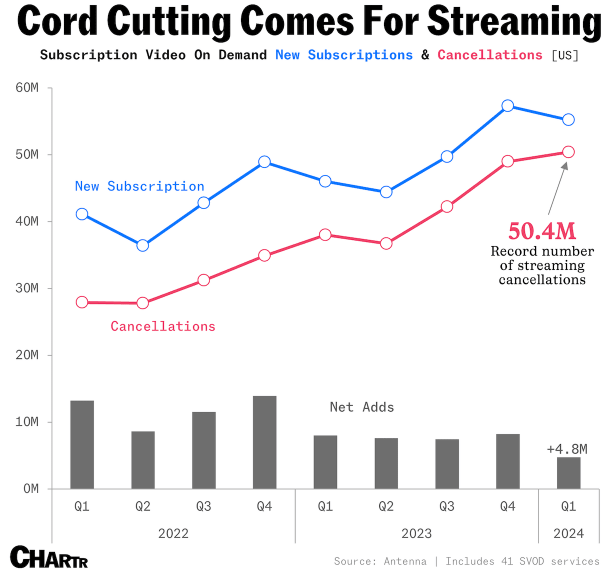
It’s part of a growing trend of cancellations.
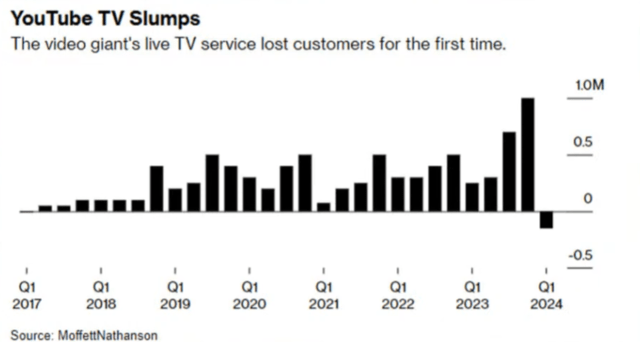
Likewise, surprisingly, subscriptions to Alphabet’s (GOOGL) live TV service, YouTube TV, saw its first-ever contraction in subscriptions in Q1 2024.
That’s partly sports-related, as cancellations tend to be pronounced in Q1 after the end of football season. But in past Q1s, the net change in subscriptions was still positive, perhaps partially because YouTube TV captured some of the cable TV cord cutters.
So, yes, while CMCSA lost ~487,000 cable TV subscribers in Q1 and are down some 2 million subscribers YoY, it’s an industry-wide problem. Consumers are cutting back on all types of video content subscriptions, whether they’re delivered through a wire or not.
I think this says more about the current state of US consumers than it does about CMCSA or cable TV.
Yes, regardless, cable TV is slowly dying. But as the cigarette makers demonstrate, it is possible to continue growing cash profits by raising prices while investing in new products.
Also keep in mind that CMCSA owns the #1 broadband provider in the country: Xfinity. Losses in cable TV could be partly offset by selling more premium broadband plans that can support streaming live video content.
